Grouped Result
About
Grouped Bolt/Rivet Strength/Fatigue result combine many results within the same group in the model tree or from selected results from different analysis using the Solution Editor into one plot. This provides a powerful overview of all bolt/rivet results in the model in one plot.
If one of the grouped results is cleared, then the Grouped Result is also automatically cleared.
Usage
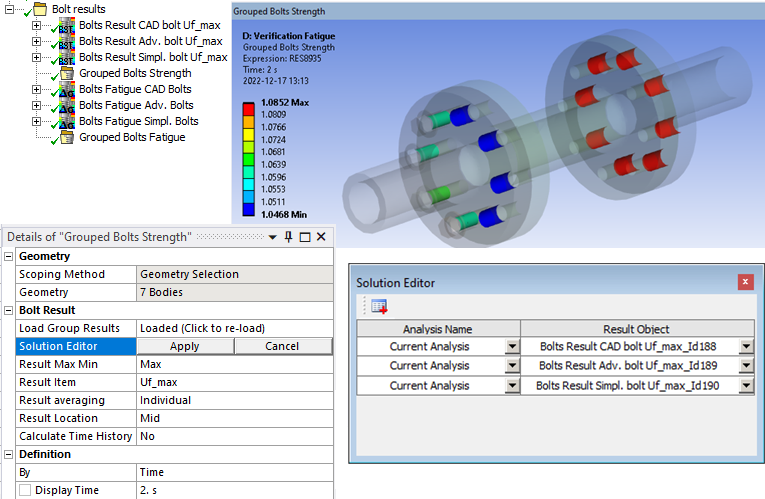
Add a “Grouped Result” to the Solution (and drag it to a folder) and click “Click here to load!”.
Inputs to define the Grouped Result are defined in the table below.
| Geometry | |
|---|---|
| Scoping Method | All Bodies (Default)/Geometry Selection/Named Selection |
| Geometry | Select bodies to limit contour plot. (i) |
| Rivet/Bolt Result | |
| Load Group Results | Click here to load! (Default) (ii) |
| Solution Editor | Tabular Data editor to select parent result objects. (iii) |
| Result Max Min | absMax (Default)/Max/Min (iv) |
| Result Item | Select a result item to display. (Default “Normal Force”) (v) |
| Result Tolerance Factor | Value between 0 (Default) to 1 to filter out result values (vi). |
| Result Averaging | Display results for each bolt Individual (Default) or as a Group average. |
| Result Location | Parent (Default)/Head/Mid/Thread Location of evaluation section for bolts. (vii) |
| Calculate Time History | No/Yes/Yes (Maximum Over Time)/Yes (Minimum Over Time) |
| Definition | |
| By | Time (Default)/Result Set/Maximum Over Time/Time Of Maximum (standard Mechanical feature) (viii). |
| Display Time | Load step time for results evaluation (ix). |
(i) Geometry
To limit post processing to specific rivets/bolts in the group edit the geometry scoping of faces or bodies. The node numbers from the selected object will be compared with the node numbers in the selection and results will only be plotted for nodes that are scooped in the selection.
(ii) Load Group Results
Click on “Click here to load!” to load all results of the same kind under solution (or in the group) to the “Solution Editor”.
Once loaded the text changes to “Loaded (Click to re-load)”.
(iii) Solution Editor
Click on “Tabular Data” to open “Solution Editor” to verify and/or edit the selected result objects.
In Solution Editor it is possible to add/remove lines and select a different analysis a corresponding result object.
(iv) Result Max Min
If multiple results objects for the same result geometry exists, this option decides what result to plot.
absMax = max(abs(res1), abs(res2), … , abs(resn))
Max = max(res1, res2, … , resn)
Min = min(res1, res2, … , resn)
(v) Result Item
The available Result Item depends on the selected Parent Result (Rivet/Bolt) and the parent Code.
The result objects in the group does not need to have the same Result Item or Time selected.
(vi) Result Tolerance Factor
The tolerance factor is evaluated for each result step on each result object. Using “Maximum Over Time” or “Calculate Time History” for a result item that is not a “utilization” this may cause confusing results since rivet/bolt values below the tolerance level is relative to each result step. For an “utilization” (dimensionless) result the tolerance level is absolute.
(vii) Result Location
The Result Location “Parent” uses the Result Location of the selected Parent Result.
Using “Head/Mid/Thread” overrules the setting in the Parent Result.
(viii) By
You may use Maximum Over Time to get the worst case from all steps.
In V242.2 the Maximum Over Time (or Minimum Over Time) changes to use the much faster option “Calculate Time History = Yes (Maximum Over Time)”.
(ix) Display Time
You may only use time steps where there are results saved, see the graph and tabular data window for load steps to use.
Output
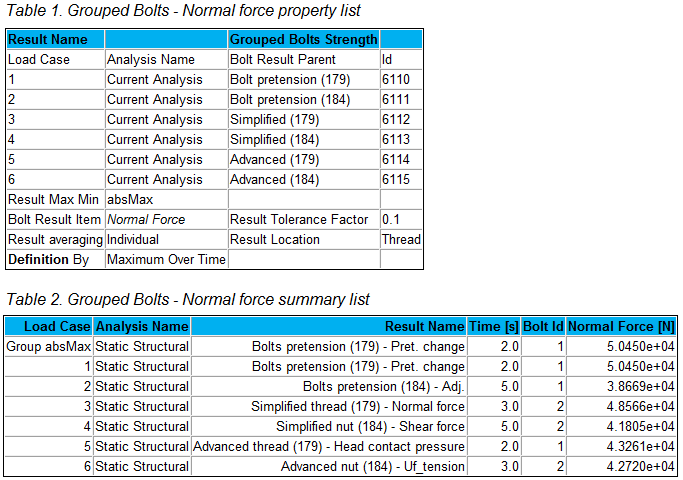
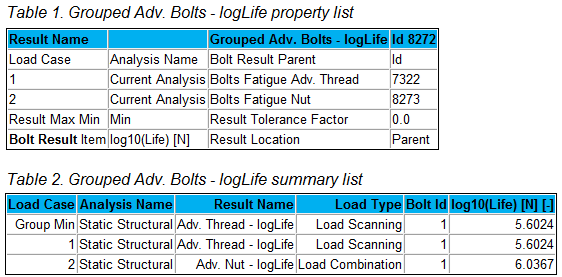
The Grouped Result creates “Details” and “Result Summary” tables that can be viewed using the Worksheet Preview and Bolt Report feature in Report Generator.
The “Result Summary” table contains the overall max/min value and a line with the time and max/min value for each included result object.