 Cumulative Damage
Table of contents
About
The “Cumulative Damage” object adds the post processing feature to evaluate a fatigue duty cycle built of different loading blocks.
Usage
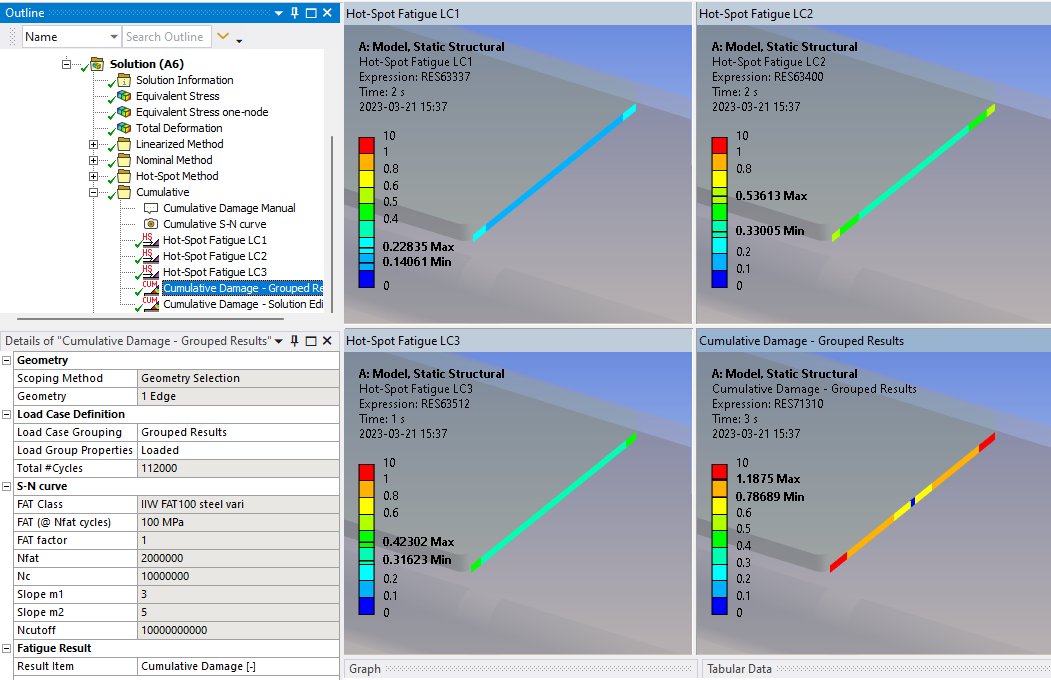
Grouping Weld Fatigue result objects of the same type with the same geometry scoping and FAT Class but different Load cases together with a “Cumulative Damage” object will sum the damage from the grouped objects and calculate the total damage and safety factor results. Load cases (from different analyses) can also be selected using the “Solution Editor”.
Inputs to define the Cumulative Damage are defined in the table below.

| Geometry | |
|---|---|
| Scoping Method | Geometry Selection/Named Selection |
| Geometry | Edges/Faces/Nodes to display results on (i). |
| Load Case Definition | |
| Load Case Grouping | Grouped Results (Default)/Solution Editor |
| Solution Editor | Tabular Data (visible only if selecting “Solution Editor”) |
| Load Group Properties | Click here to load! (Default) |
| Total #Cycles | (Read Only) |
| S-N curve | |
| FAT Class | (Read Only) |
| FAT (@ Nfat cycles) | (Read Only) |
| FAT factor | (Read Only) |
| Nfat | (Read Only) |
| Nc | (Read Only) |
| Slope m1 | (Read Only) |
| Slope m2 | (Read Only) |
| Ncutoff | (Read Only) |
| Fatigue Result | |
| Result Item | Select a Result Item to display. |
| Display Graph | No (Default)/Yes. If Geometry are edges the path result is displayed in the Graph window. |
| Definition | |
| By | Time (Default) |
| Display Time | Time step to use for deformed shape. Does not influence the result. |
(i) Geometry
To limit post processing to specific locations in the group edit the geometry scoping. The node/element numbers from the selected parent object will be compared with the numbers in the selection and results will only be plotted for items that are scooped in the selection.
Load Case Definition
The cumulative load case can be defined in two different ways using either “Grouped Results” (Legacy) or “Solution Editor”.
Grouped Results
- Create a grouping folder in the model tree containing the Weld Fatigue objects that builds the duty cycle and add a Cumulative Damage object to the group.
- You may drag and drop result objects into or out from the group to edit the duty cycle.
- Click the Load Group Properties “Click here to load!” to validate the grouped result objects and loading the geometry and S-N curve details.
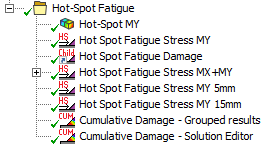
Do not group different result items of the same load case, e.g. Life, Damage and Stress range, since this will sum the damage for each one, use a Child Result to plot those result instead!
You may have several Cumulative Damage and Child Results in the same group.
Solution Editor
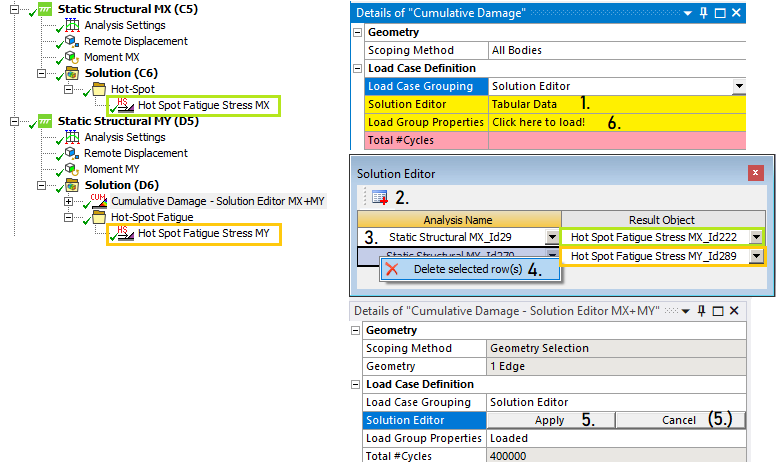
You may use the Load Case Grouping “Solution Editor” option to select result objects from any linked analysis to define the cumulative load case.
- To edit the “Solution Editor” click on “Tabular Data”.
- Click the “Add row” icon in the table editor.
- For each row select the “Analysis Name” (Default “Current Analysis”) and a “Result Object”.
- To delete a row right-click on a cell and select “Delete selected row(s)”.
- Click “Apply” to confirm and close the editor (or click “Cancel” to discard the changes).
- Click the Load Group Properties “Click here to load!” to validate the selected result objects and loading the geometry and S-N curve details.
If selecting result objects with different scoping, type or S-N curve an error message is displayed. The validation of the solution combination is also always done when evaluating the result.
Result Items
The result items are also marked in the figure above.
| Result Item | Description |
|---|---|
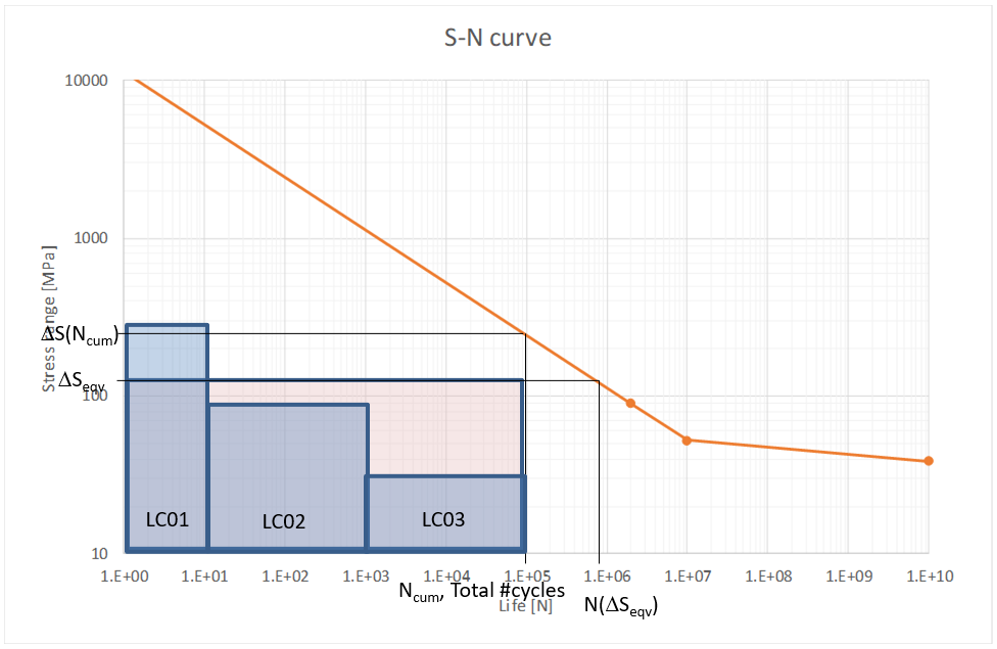
| Cumulative Damage [-] | Sum of the damage from each load block, Dcum. |
| Safety factor life [#blocks] | Number of loading blocks, SFN = 1/Dcum = N(Δσeqv)/Ncum. |
| Equivalent Stress range | Constant stress range with same total damage as the duty cycle, Δσeqv. |
| Safety factor stress | Ratio of allowed stress range to Equivalent stress range, SFS = Δσ(Ncum)/Δσeqv. |
| Stress utilization | 1/SFS = Δσ/Δσ(Ncum) |
| Life Quality | Quality measure based on mesh size. |
| Path pos | Path coordinate along geometry edge. (i) |
(i) Path pos
Each fatigue result can display the selected result item in the Graph window using the new property “Display Graph = Yes” if the Geometry scoping is “Edge”.
Display Graph
For a fatigue result with one continuous set of edges a path plot of the selected Result Item can be displayed in the Graph window. The output csv file is sorted with the “Path pos” for each group of edges.
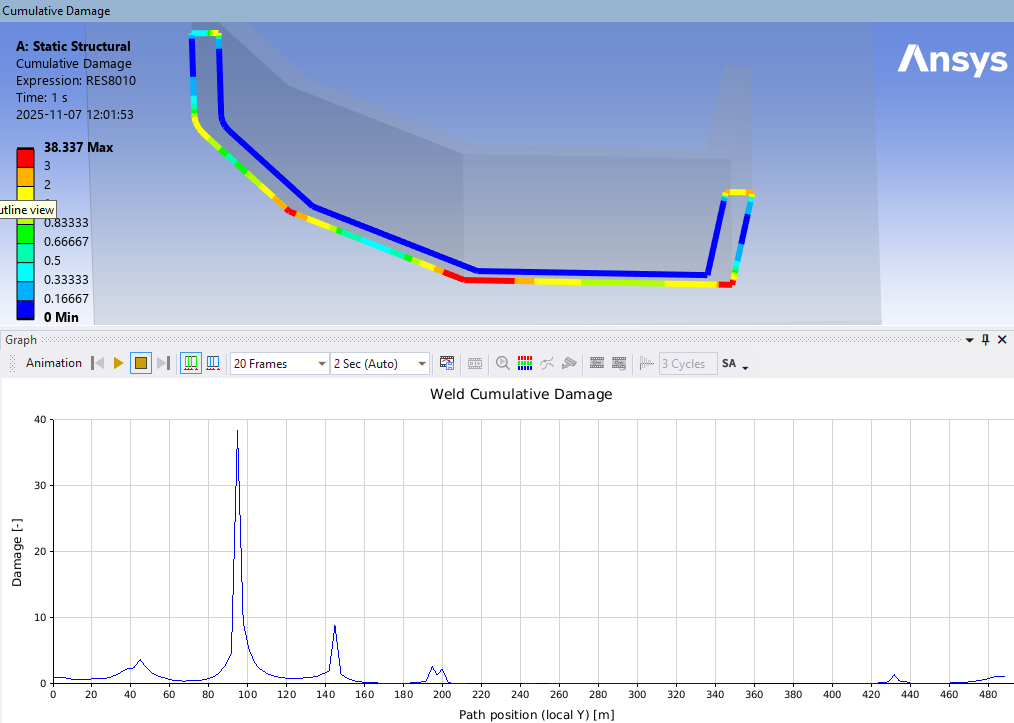
The direction of the path is decided by the first two edges in the Geometry scoping.
Output
The Cumulative Damage object writes a property and result csv files to the solver files directory of the analysis. These files are used by the Weld Report features and can easily be imported to Word or Excel.
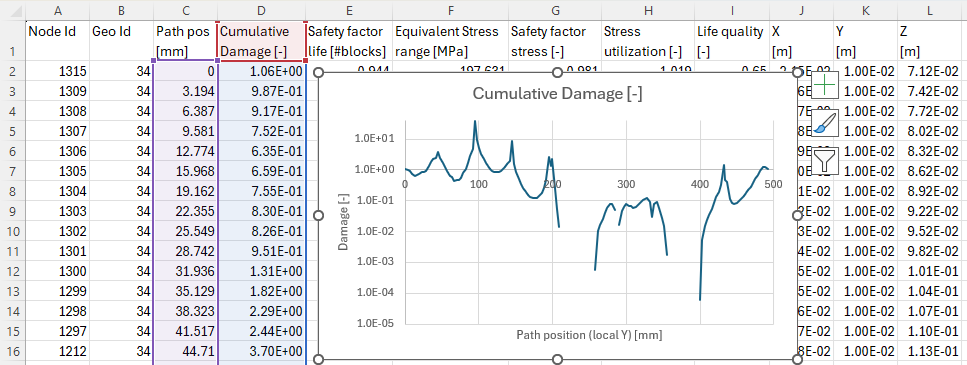
In addition to the available Result Items the csv file contains node, geo and coordinate information. The table is sorted in “Path pos” for each group of edges to do graphs in e.g. Excel. The data can also be sorted using the X, Y, Z coordinates if needed.
| Result Item | Description |
|---|---|
| Node Id | Node numbers from result object. |
| Geo Id | Face or edge Id number. |
| Path pos | Edge path position. |
| … | … |
| X | Node X coordinate in global system. |
| Y | Node Y coordinate in global system. |
| Z | Node Z coordinate in global system. |
The csv file name will not change if the result is renamed. Clear and evaluate to re create the csv file.