Contact Pressure As A Function Of Coordinates (VS Code and Jupyter)
This is an example utilizing PyMAPDL through VS Code together with the VS Code Jupyter extension. Click the Download button to download the .ipynb file.
The code is divided into several blocks and are presented below.
Import necessary modules.

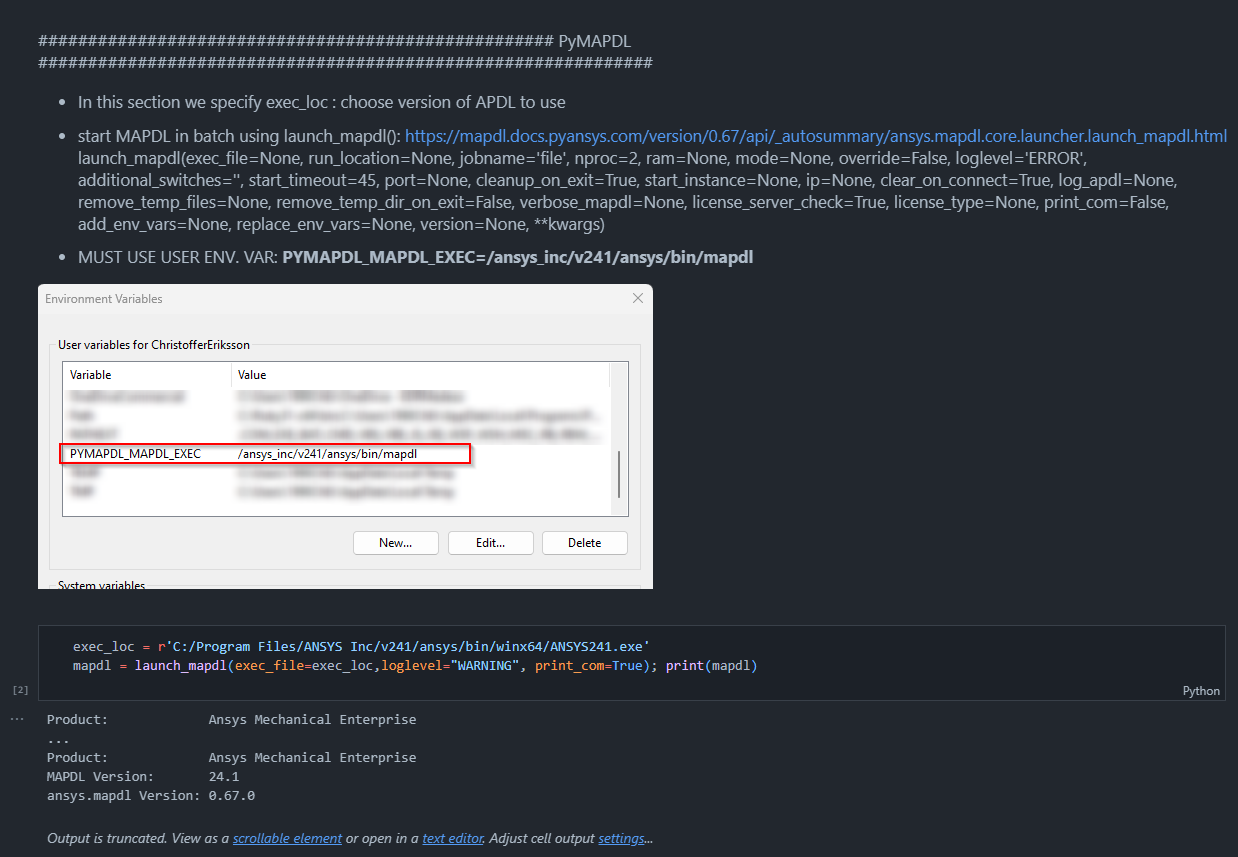
Create a local (user) environment variable pointing at the mapdl executable directory. This is a comment in the jupyter file. Then we launch MAPDL 2024R1 in background with the mapdl python command.
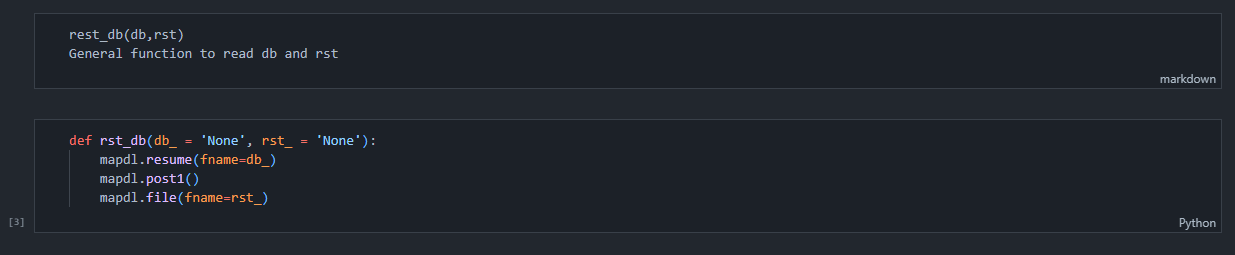
Create a general function that resumes a .db file, goes into /POST1 and reads a .rst file.
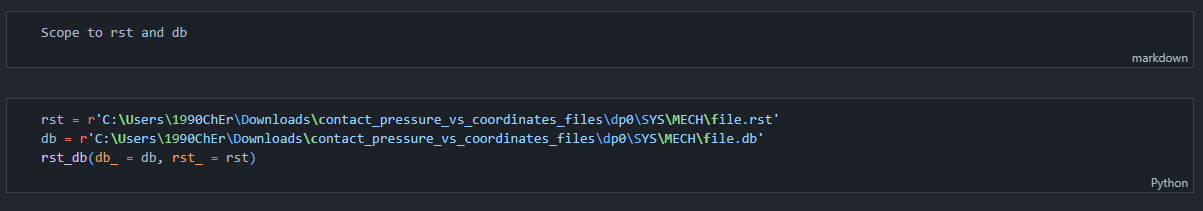
Define the path(s) to the .db and .rst and run the rst_db function.
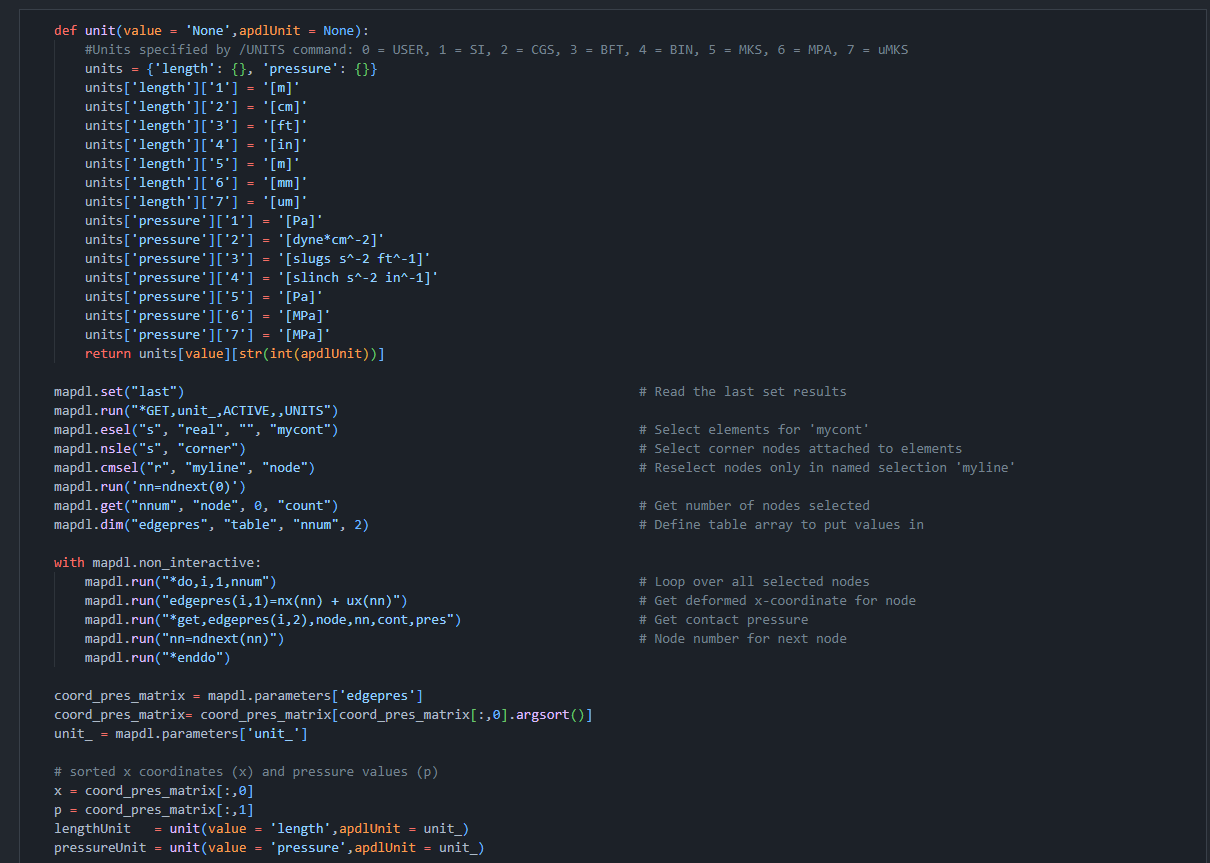
Next we define a python function taking care of units. Then, we issue a bunch of mapdl.<function>(…) commands.
This is when PyMAPDL really kicks in. The commands can be written in different ways, e.g. the APDL command SET,LAST can be written either as mapdl.set(“last”) (pythonically) or *mapdl.run(“set,last”).
One interesting thing that we do in this example is that we create a table array, with the mapdl.dim(“edgepres”,”table”,”nnum”,2) command. This is done in APDL so it is NOT a python list (yet). Then, we populate this table with values through a loop (still in APDL). Once the loop is finished, the PYTHON command coord_pres_matrix = mapdl.parameters[‘edgepres’] actually fetches the APDL table edgepres and translates it to a python list!
Conclusion from that single line of code is that we don’t need to send the APDL table to a .txt file, fetch the text file using python, check formatting and create coord_pres_matrix. Instead, we can make use of PyMAPDL in a very neat way.
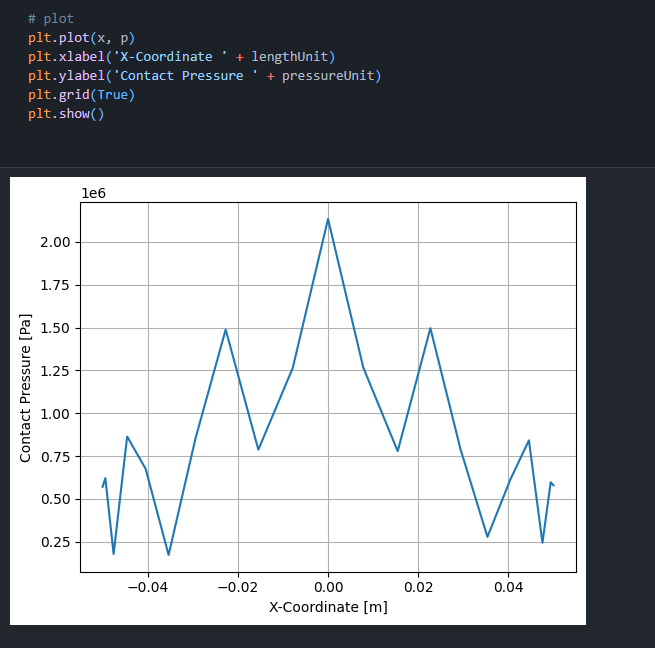
Lastly, we plot the contact pressure as a function of the x-coordinate through matplotlib.