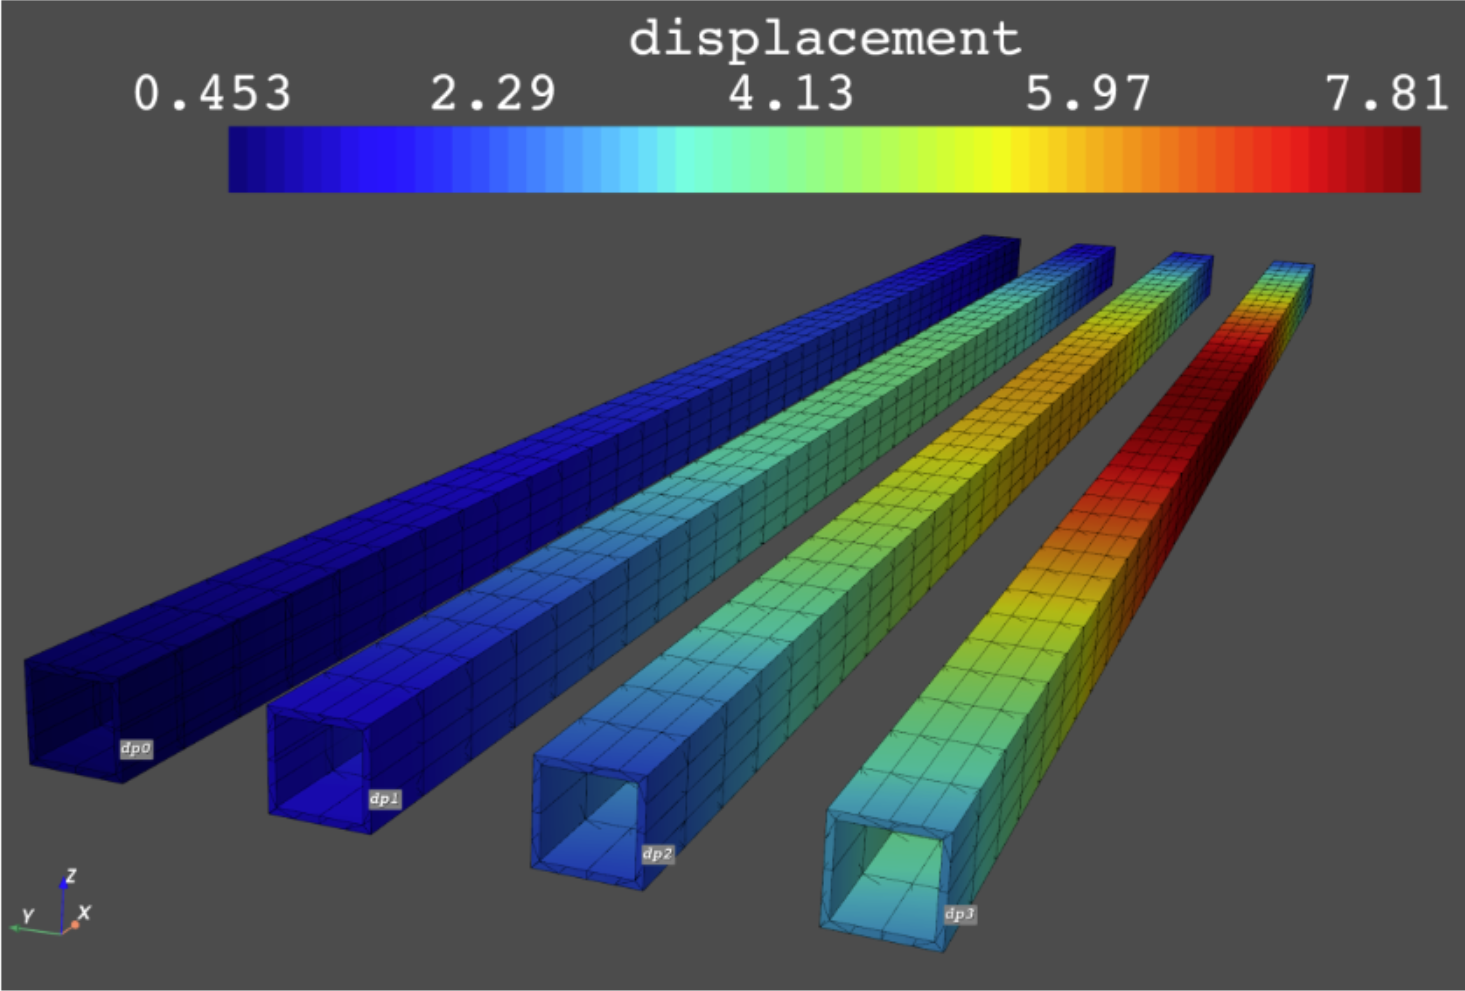
CPython code to plot multiple results in one window.
When running parametric simulations it can often be of value to examine results from each design point to validate the inputs (i.e. to get a quick overview). This PyDPF example shows a simple way to plot a deformation result for N design points in the same GUI. Before you solve the analysis, define
projectFolder = “path to project folder”
myNamedSel = ‘NAMEDSEL’ where ‘NAMEDSEL’ is the name of a Named Selection

from ansys.dpf import core as dpf
from ansys.dpf.core.plotter import DpfPlotter
import os
plotter = DpfPlotter()
############################################### user inputs
projectFolder = "C:\\Temp\\multi_plot\\"
myNamedSelName = 'NAMEDSEL'

fileList = os.listdir(projectFolder)
dp_dict = {}
for fileName in fileList:
    if 'dp' in fileName:
        dp_dict[fileName] = projectFolder + fileName + "\\SYS\\MECH\\file.rst"
# Loop over all dps
for i, dp in enumerate(dp_dict.keys()):
    # Extract current dp and read the corresponding result file
    rstFilePath = dp_dict[dp]
    model = dpf.Model(rstFilePath)
    # Global mesh
    myGlobalMesh = model.metadata.meshed_region
    # Named selection scoping to 'NAMEDSEL'
    ns_op=dpf.operators.scoping.on_named_selection(requested_location='Nodal',named_selection_name=myNamedSelName,data_sources=model)
    # Extract skin mesh to reduce computational time
    mesh_skin = dpf.operators.mesh.skin()
    mesh_skin.inputs.mesh.connect(myGlobalMesh)
    mesh_skin.inputs.mesh_scoping.connect(ns_op)
    result_mesh = mesh_skin.outputs.mesh()
    # Calculate displacement for current DP and translate the mesh ( here in - Y direction )
    stress_operator = dpf.operators.result.stress_von_mises()
    stress_operator.inputs.requested_location.connect('Nodal')
    stress_operator.inputs.data_sources.connect(model)
    #stress_operator.inputs.mesh.connect(result_mesh)
    stress_nodal = stress_operator.outputs.fields_container()[0]

    overall_field = dpf.fields_factory.create_3d_vector_field(1, dpf.locations.overall)
    overall_field.append([0.0, -100*i, 0.0], 1)
    coordinates_to_update = result_mesh.nodes.coordinates_field
    add_operator = dpf.operators.math.add(coordinates_to_update, overall_field)
    coordinates_updated = add_operator.outputs.field()
    coordinates_to_update.data = coordinates_updated.data
    # Add displacement for current DP in plotter
    plotter.add_field(
        stress_nodal,
        result_mesh,
        show_max = False,
        show_min = False,
        label_text_size = 15,
        label_point_size = 1,
        )
    # Place a label on the result with text  =  dp i
    node = [result_mesh.nodes[0]]
    label = [dp]
    plotter.add_node_labels(
        node,
        result_mesh,
        label,
        italic=True,
        bold=True,
        font_size=26,
        text_color="white",
        font_family="courier",
        shadow=True,
        point_color="grey",
        point_size=1,
        )

plotter.show_figure(show_axes=True)