Create Graph
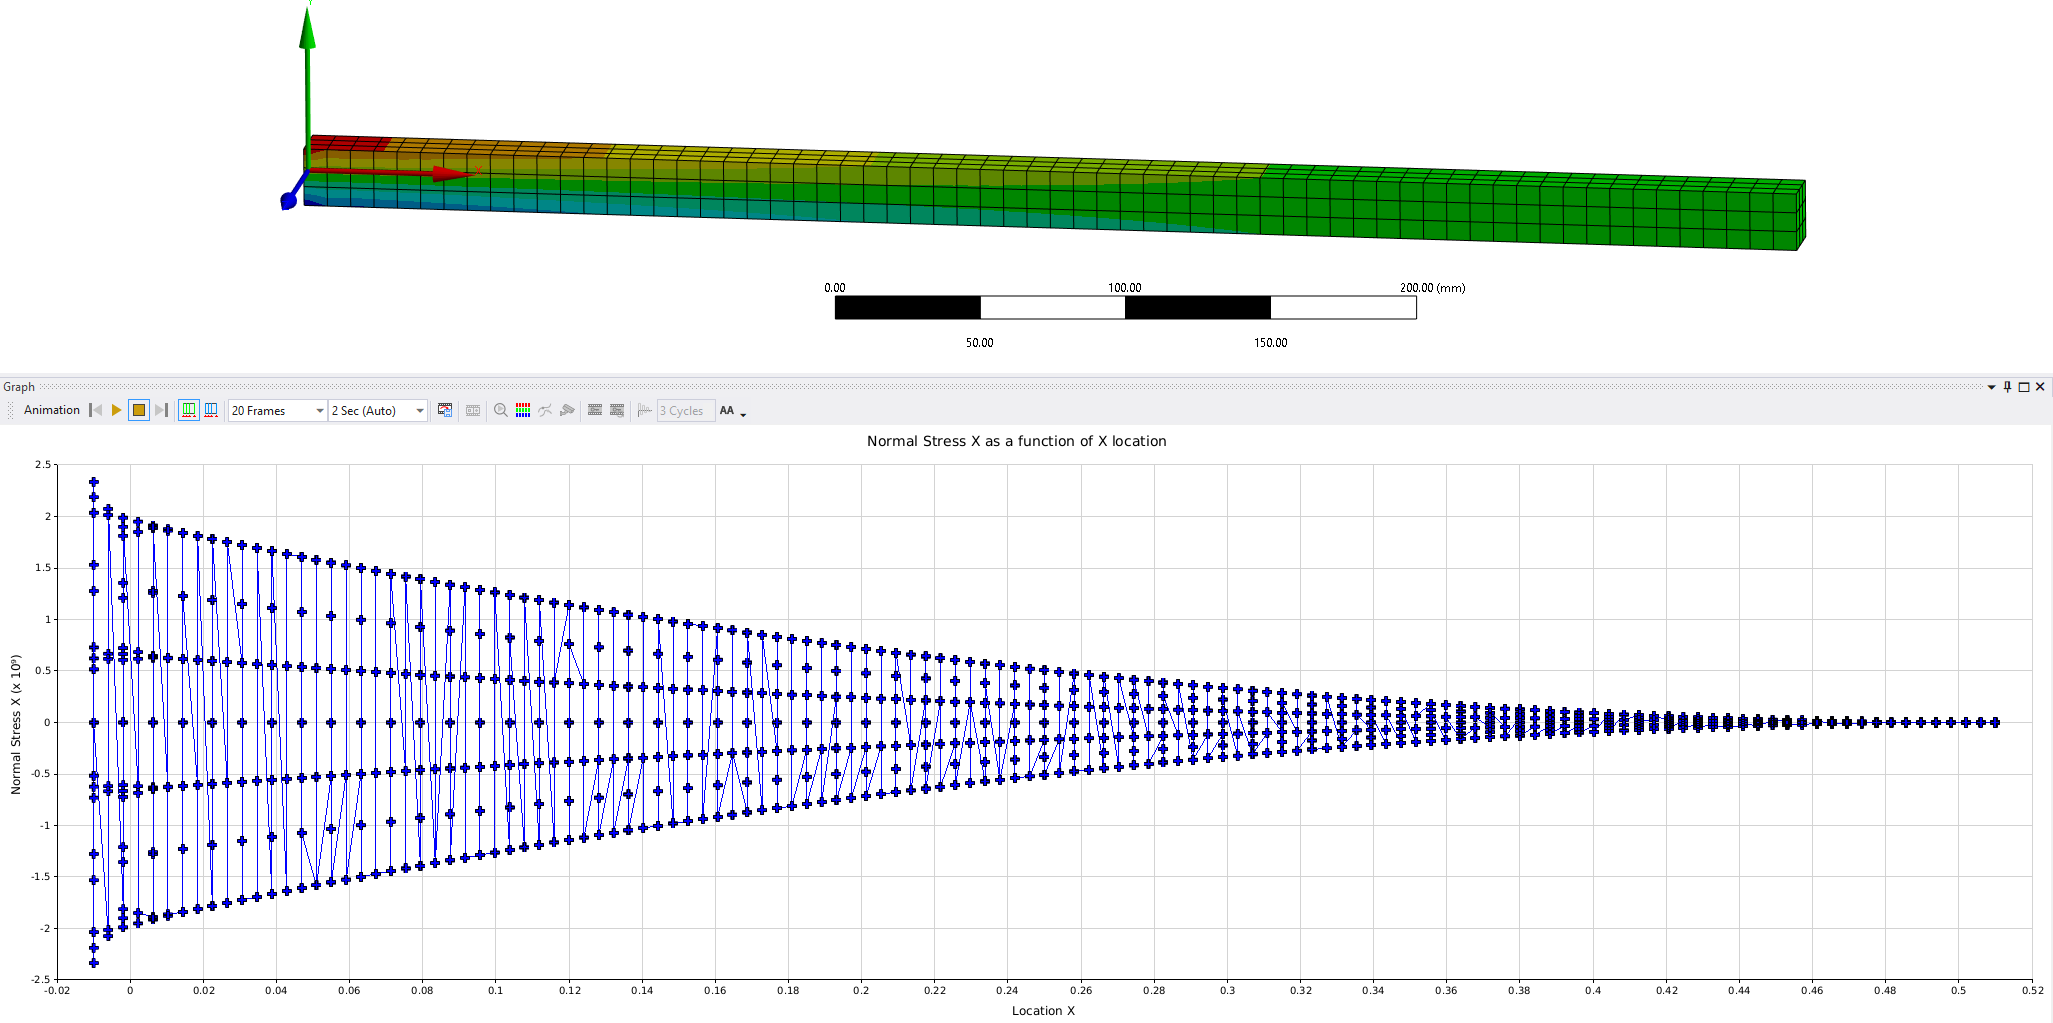
This code takes a result name as user input, e.g. resultName = “Normal Stress”. This script creates a Graph from a Normal Stress result scoped to a body.
from operator import itemgetter
################################ User Input resultName = "Normal Stress" in this example.
resultName = "Normal Stress"

resultObj = DataModel.GetObjectsByName(resultName)[0]
try:
    if figurePanels.Count > 0: pass
except: figurePanels = []
nodes = resultObj.PlotData['Node']
values = resultObj.PlotData['Values']
node_values = {}
for index,value in enumerate(values): node_values[nodes[index]] = value
sorted_z_list = []
mesh = Model.Analyses[0].MeshData
node_loc_unsorted = {}
for node in nodes:
    node_mesh = mesh.NodeById(node)
    node_loc_unsorted[node]=node_mesh.X
node_loc = sorted(node_loc_unsorted.items(), key=itemgetter(1), reverse=False)
X = []
Y = []
for loc in node_loc:
    X.append(loc[1])
    Y.append(node_values[loc[0]])
X = sorted(X, key = float)
import chart
# --- Create Figure ---
figure = chart.Figure()
figures = chart.Figures(0,0)
figure.title('Normal Stress X as a function of X location')
figure.xlabel('Location X')
figure.ylabel('Normal Stress X')
figurePanel = ExtAPI.UserInterface.AttachControlToPanel(figures.view, MechanicalPanelEnum.Graph)
# Clear the old figures and replot
figures.clear()
figure.plot(X, Y, '+bo+')
figure.legend()
figures.setfigures(1,1,figure)
figurePanel.Show()
figurePanels.append(figurePanel)
#for f in figurePanels: f.Close()