Draw Coordinate System
Make use of ExtAPI.Graphics to draw graphics. Here is an example of how to draw a coordinate system. Note. Run Graphics.Scene.Clear() to clear the graphics!
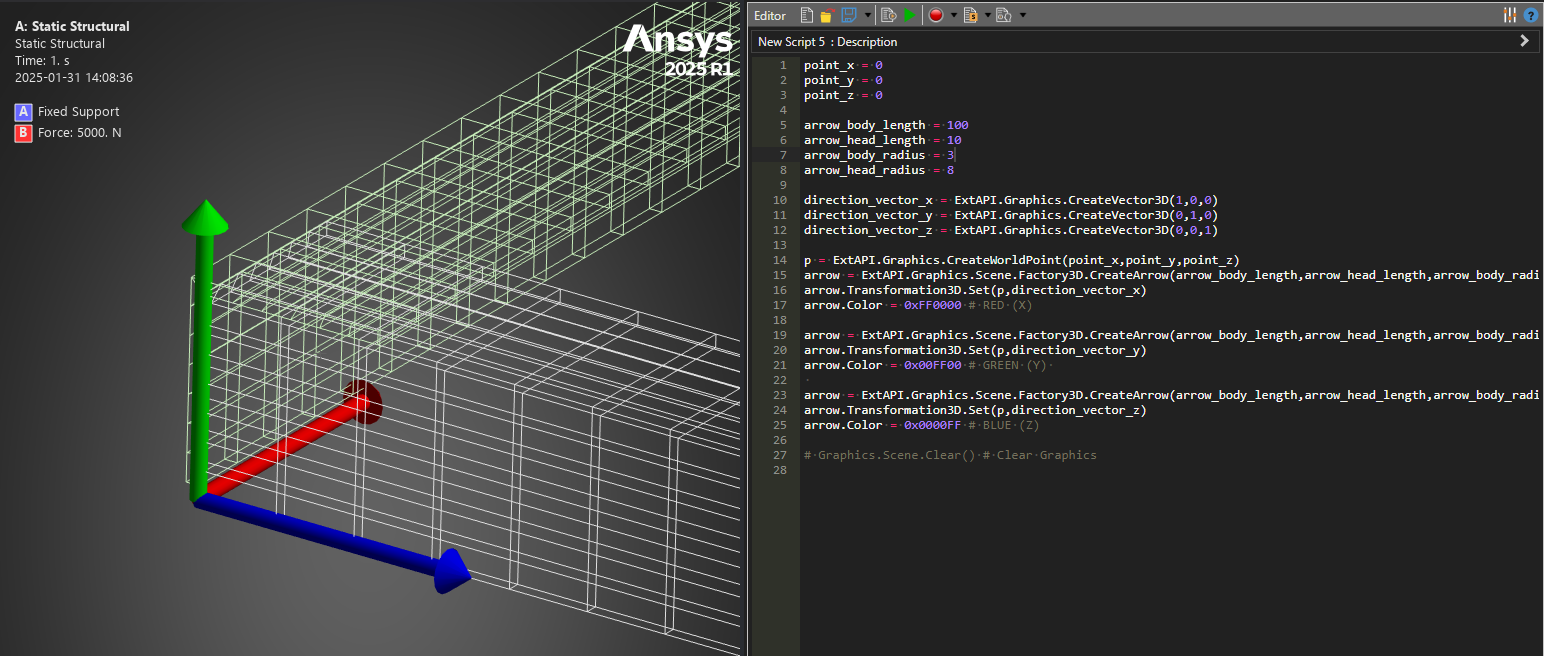
point_x = 0
point_y = 0
point_z = 0

arrow_body_length = 100
arrow_head_length = 10
arrow_body_radius = 3
arrow_head_radius = 8

direction_vector_x = ExtAPI.Graphics.CreateVector3D(1,0,0)
direction_vector_y = ExtAPI.Graphics.CreateVector3D(0,1,0)
direction_vector_z = ExtAPI.Graphics.CreateVector3D(0,0,1)

p = ExtAPI.Graphics.CreateWorldPoint(point_x,point_y,point_z)
arrow = ExtAPI.Graphics.Scene.Factory3D.CreateArrow(arrow_body_length,arrow_head_length,arrow_body_radius,arrow_head_radius)
arrow.Transformation3D.Set(p,direction_vector_x)
arrow.Color = 0xFF0000 # RED (X)

arrow = ExtAPI.Graphics.Scene.Factory3D.CreateArrow(arrow_body_length,arrow_head_length,arrow_body_radius,arrow_head_radius)
arrow.Transformation3D.Set(p,direction_vector_y)
arrow.Color = 0x00FF00 # GREEN (Y)

arrow = ExtAPI.Graphics.Scene.Factory3D.CreateArrow(arrow_body_length,arrow_head_length,arrow_body_radius,arrow_head_radius)
arrow.Transformation3D.Set(p,direction_vector_z)
arrow.Color = 0x0000FF # BLUE (Z)

# Graphics.Scene.Clear() # Clear Graphics