Fatigue Scanning Documentation
 Fatigue Scanning
About
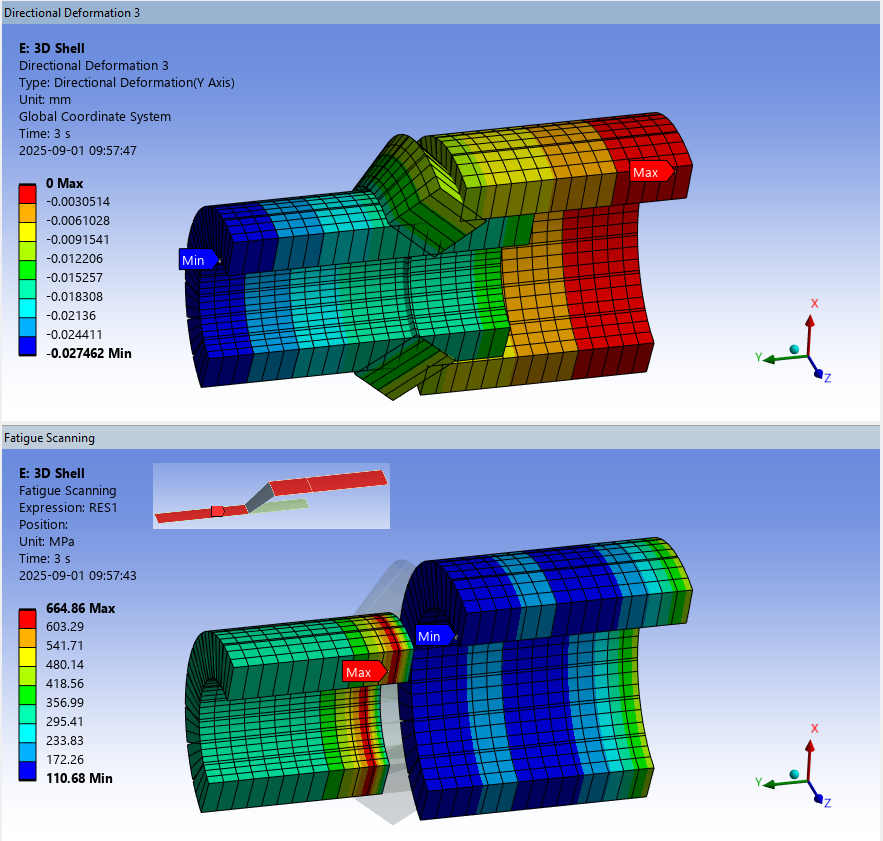
The Fatigue Scanning calculates the stress or strain range from a selected range of solution time points or solution combination.
Usage
- Click the “Fatigue Scanning” button to add to the current selected solution (Static or Transient structural).
Inputs to define the Fatigue Scanning are:
| Geometry | |
|---|---|
| Scoping Method | All Bodies (Default)/Geometry Selection/Named Selection (i) |
| Geometry | Vertex/Edge/Face/Body/Node/Element (i) |
| Definition | |
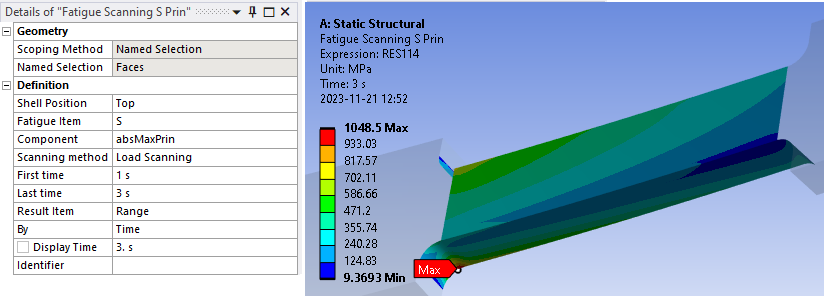
| Shell Position | Top (default)/Middle/Bottom (Used for 3D shells only) |
| Fatigue Item | S (default)/EPEL/EPTO (Stress, Elastic strain, Total strain) |
| Component | absMaxPrin (default)/EQV (max(abs(S1),abs(S3)), von-Mises) |
| Scanning method | Load Scanning (default)/Solution Combination |
| First time | Time of first result step (default 1.0 s) Visible for “Load Scanning” (ii) |
| Last time | Time of last result step (default 2.0 s) Visible for “Load Scanning” |
| Solution Combination | Table editor to define “Time” and “Coefficient”. Visible for “Solution Combination” |
| Result Item | Range/Max Time 1/Max Time 2 (iii) |
| By | Automatically set to “Time” to avoid “Maximum Over Time” |
| Display Time | Automatically set to “Last time”. (Does not influence the evaluation). |
| Identifier | Result item name for use in User Defined Result “Expression”. |
(i) Geometry
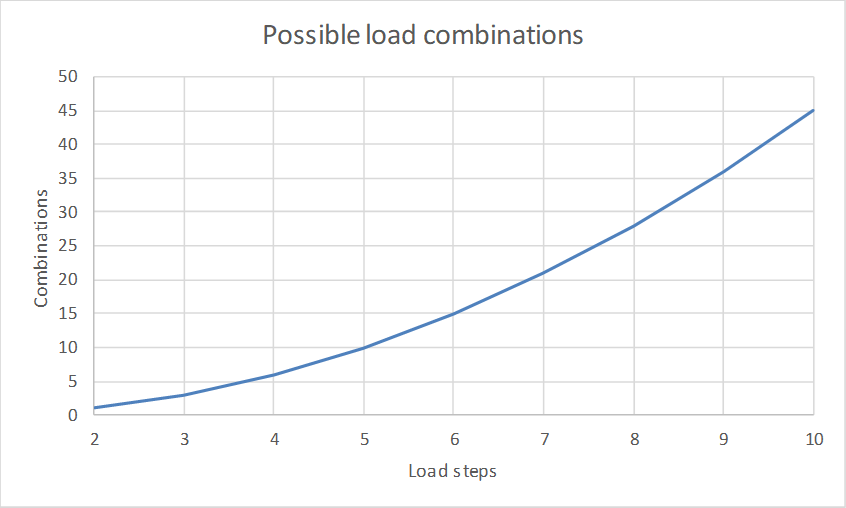
Use a limited number of faces. In case of many load steps (>5) and large selections the evaluation time will be huge due to the large number of combinations to calculate for each node.
The ACT Log File lists the progress of load combination.
(ii) First Time
First time can be zero to include scanning from un-loaded condition.
(iii) Result Item
“Range” plots the stress or strain range.
“Max Time” plots the identified time steps defining the range.
Solution Combination
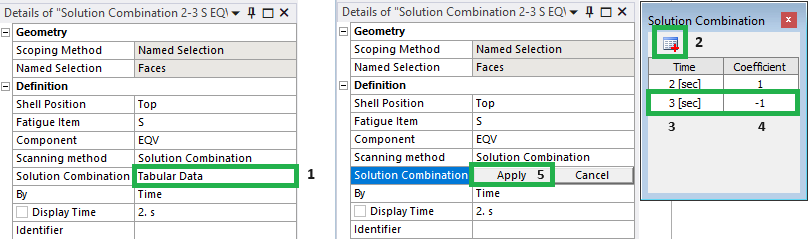
- To edit “Solution Combination” click on “Tabular Data”.
- Click the “Add row” in the table editor.
- Type in a solution time step.
- Define the load step scaling coefficient (must not be 0).
- Click “Apply” to save the data and close the editor.
(Click “Cancel” to close without saving).
Do not click the red “Close window” button!
Output
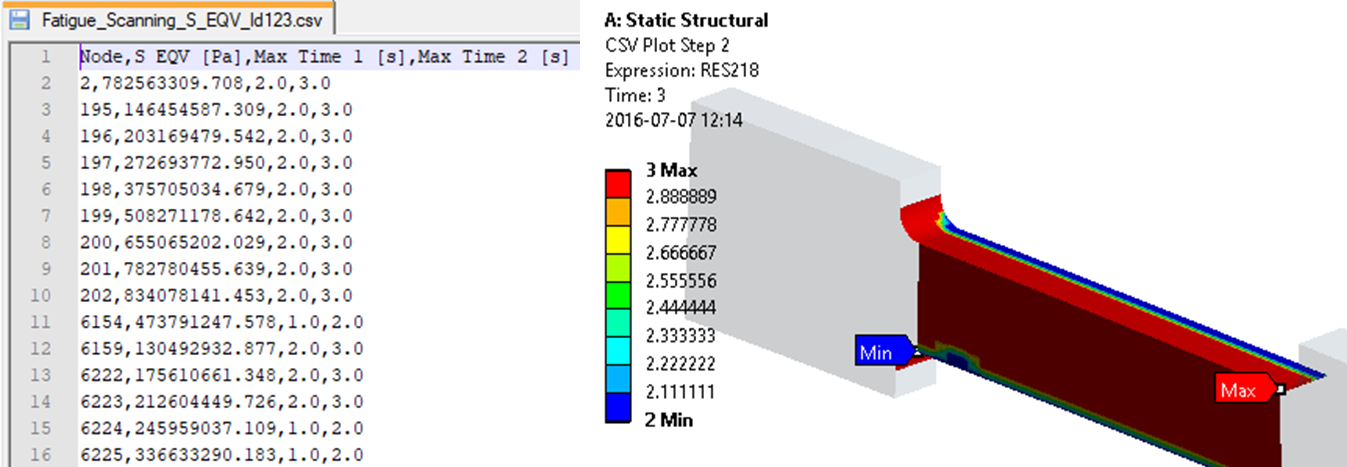
The output from Fatigue Scanning is a csv file written to the solution folder with the same name as the result object.
This can be used for external fatigue analysis and plotted using the general-purpose tool CSV-Plot.
Verification
In the Downloads section there is a demo model to compare the app result with the standard “Solution Combination”.
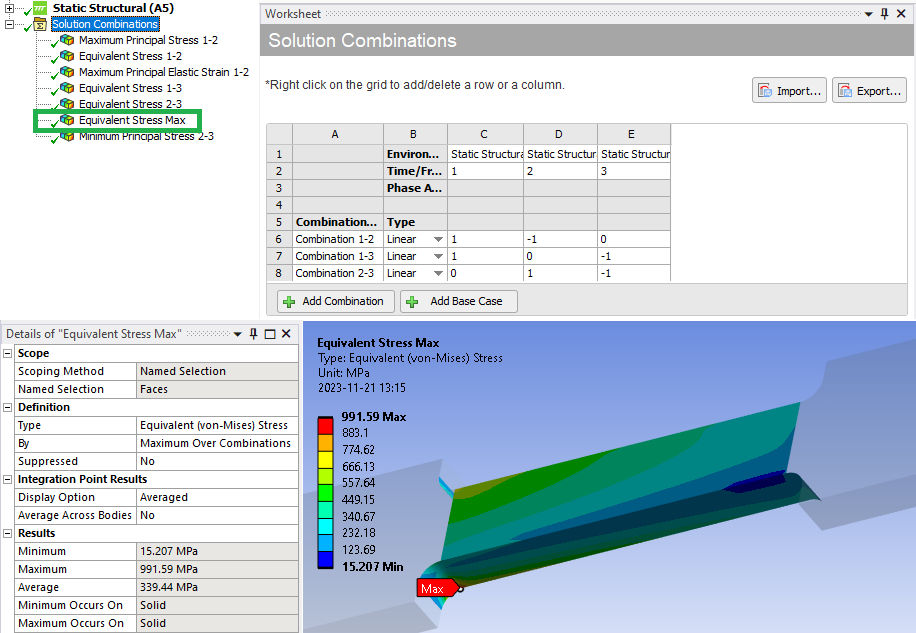
Ansys “Solution Combination” can be used to define multiple load case operations and calculate the “Maximum over Combinations”.
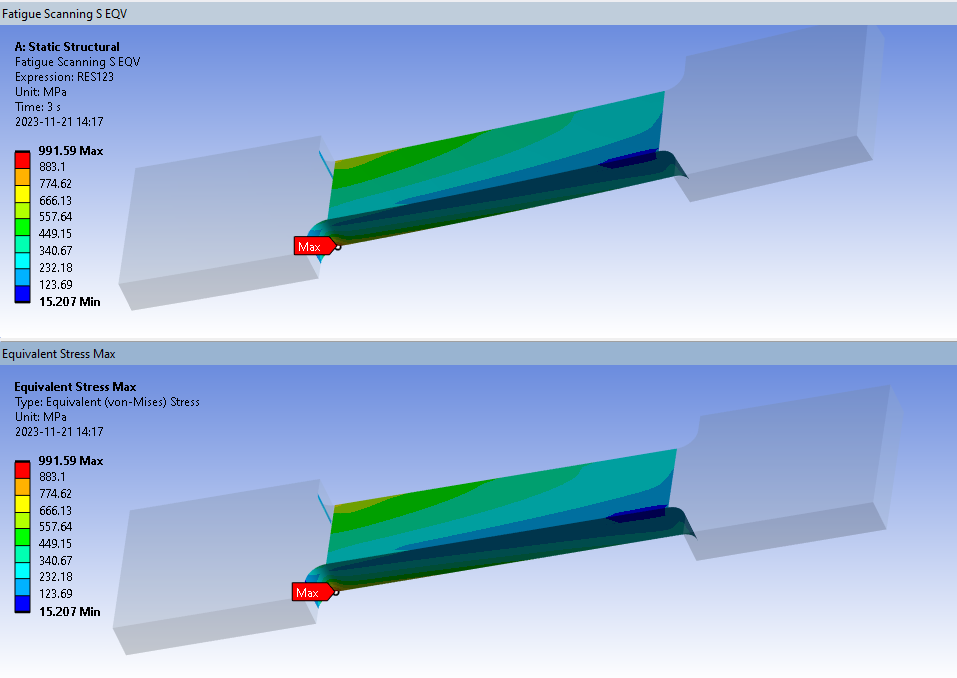
Solid model
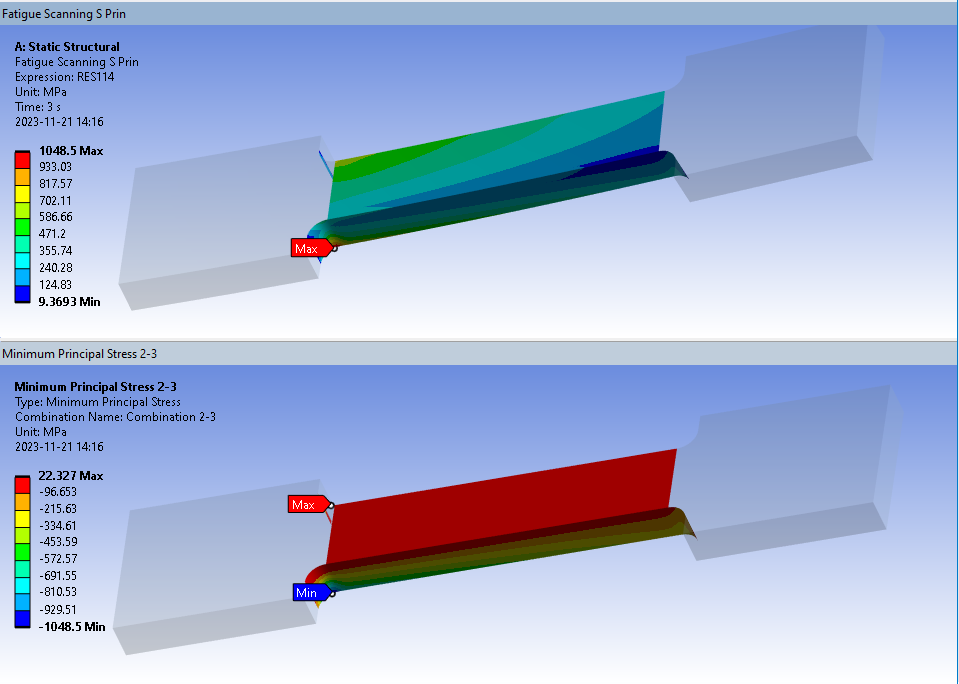
When comparing solution combination of principal stress both the maximum and minimum principal stress should be compared.
The app uses the “absMaxPrin = max(abs(S1),abs(S3))”.
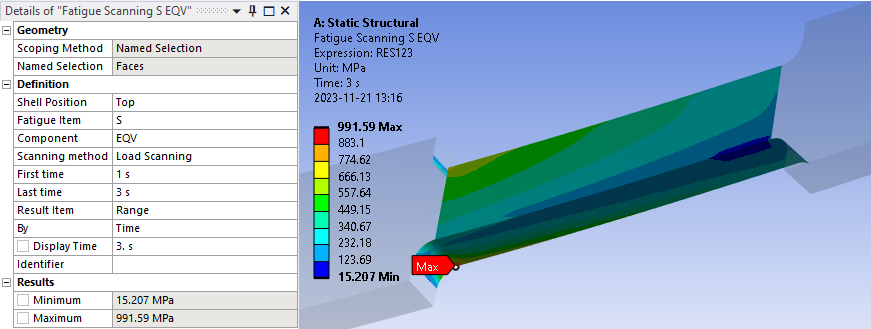
When comparing solution combination of equivalent stress the result is by definition positive.
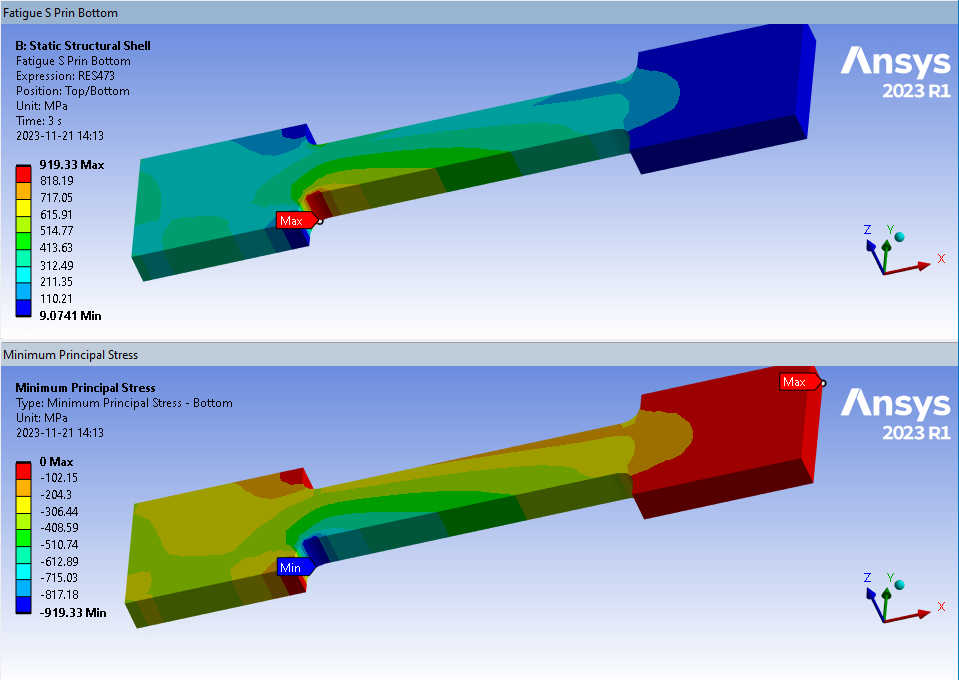
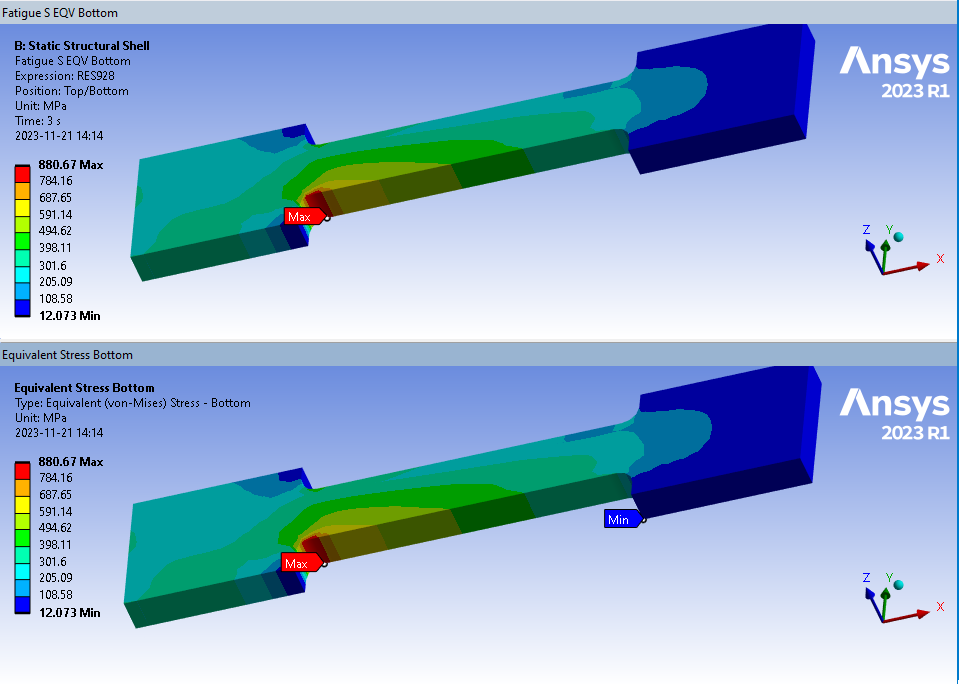
Shell model
When comparing solution combination of shell models the Shell Position must be checked for both “Top” and “Bottom”.
Principal stress comparison (bottom layer).
Equivalent stress comparison (bottom layer).
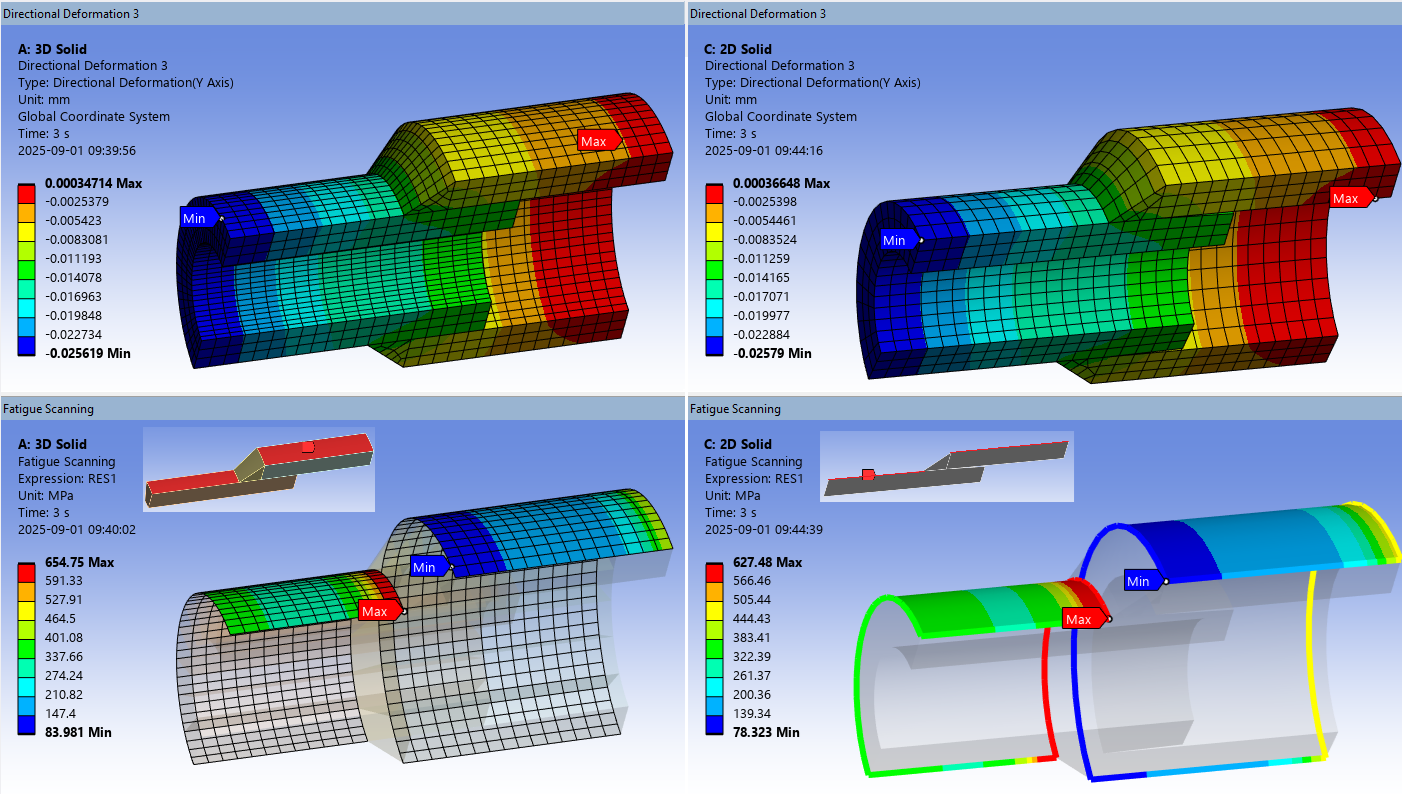
Axi-symmetric models
The app can be used with “Symmetry” boundary conditions (“Symmetric” and “Axi-symmetric”) both in 3D (solid, shell) and 2D (solid). A new verification model Axisymm2025R2.wbpz demonstrates the capabilities.
3D Solid sector (left) vs. 2D Solid sector (right)
Select the edges of a 2D solid to post process the faces.
In previous versions (< V241.3) you needed to set “Shell Position = Bottom” in the 2D analysis to get correct values for the “shell” elements.
3D Shell sector
Use “Shell Position” as normal, in this case “Shell Position = Top” to evaluate on the shell top side.