CSV Plot
Table of contents
 CSV Plot
About
The CSV Plot is a feature to read nodal or elemental result values from a comma separated values text file (csv) and plot on the geometry.
Usage
Click the “CSV Plot” button in the toolbar to add to the current selected solution.
Inputs to define the CSV Plot are:
| Geometry | |
|---|---|
| Scoping Method | All Bodies (Default)/Geometry Selection/Named Selection (i) |
| Geometry | Vertex/Edge/Face/Body/Node/Element (i) |
| Definition | |
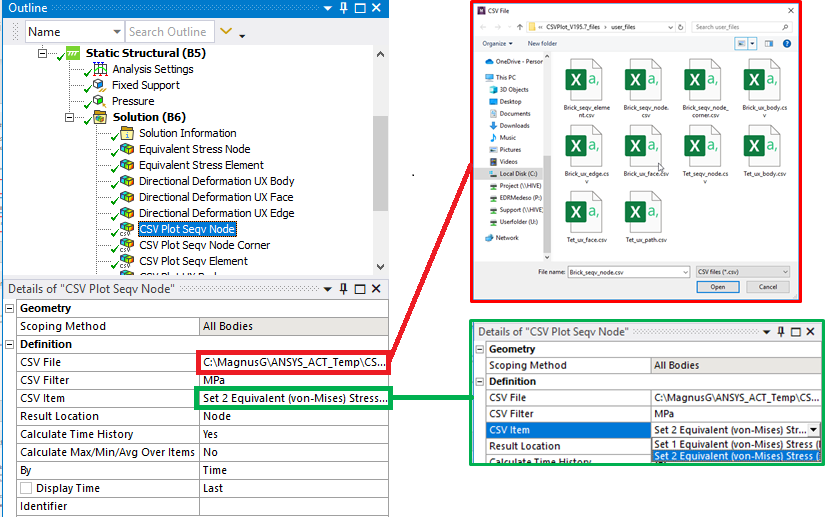
| CSV File | Open file dialog to browse to the csv file. |
| CSV Filter | Text to identify items to use. (Default *) |
| CSV Item | List box to select one of the available results in the csv file. |
| Result Location | Node (Default)/Element Type of data in the CSV file (ii) |
| Calculate Time History | No (Default)/Yes Set to “Yes” to use “Maximum Over Time” or “Time Of Maximum” |
| Calculate Max/Min/Avg Over Items | Alternative to “Calculate Time History = Yes”. See page “CSV File Multiple Load Case Data”. |
| By | Time (Default)/Result Set/Maximum Over Time/Time Of Maximum |
| Display Time | Load step time for deformed shape. |
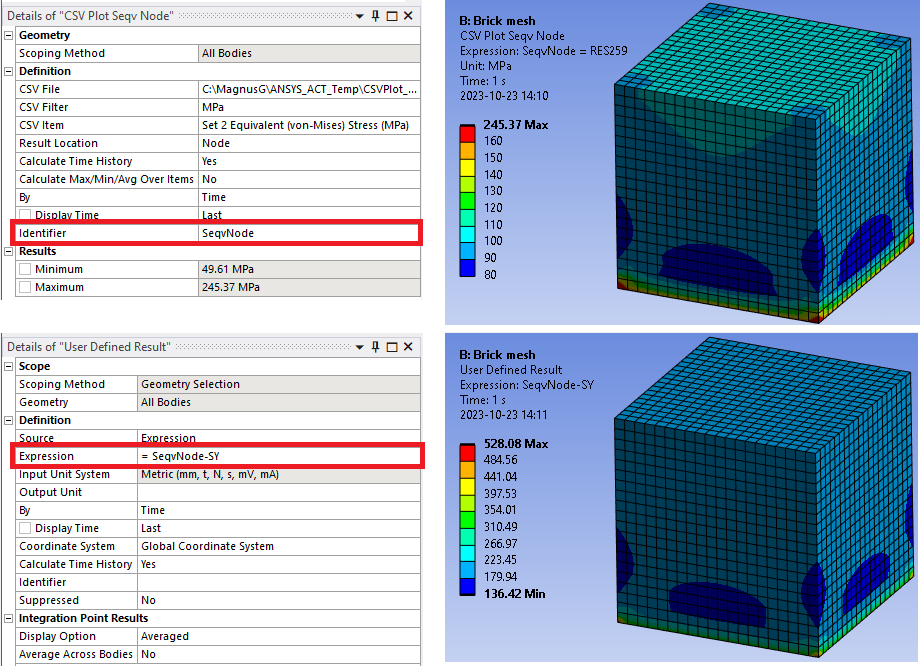
| Identifier | Result item name for use in User Defined Result “Expression”. |
(i) Geometry
The node or element numbers in the csv file will be compared with the selection and results will only be plotted for numbers that are scoped in the selection. The default “All Bodies” will always work but will be slower compared to select the corresponding geometry as is defined in the csv file. You may also limit the selection to certain faces and not plot the entire contents of the csv file.
(ii) Result Location Node
If the csv file only contains results data for corner nodes mid node results will be interpolated.
CSV File Definition
The csv file can be created in any way, e.g. from Excel a csv file can be created by “Save as type: CSV (Comma delimited) (*.csv)”. There are a number of rules that the file must fulfil in order to work.
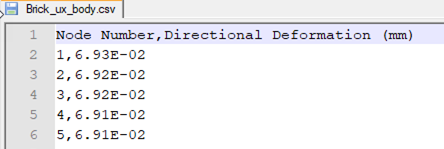
- First line is header line with column description including unit string.
- First column is node or element numbers (may be saved as integer or floating point number).
If “Node” or “Element” is in the name on the first row the “Result Location” is set correspondingly. - All fields must be comma (or semi colon) separated values, hence “CSV”.
If field separator is comma decimal point separator must be used.
If field separator is semi colon decimal point or decimal comma may be used. - The unit string must be defined as Workbench standard e.g. “[mm]” or “(N mm^-2)”.
- A unit string is optional and without a valid unit string the result will be “Dimensionless”.
The unit string can be enclosed in “( )” or “[ ]”. If you have multiple parentheses of the same type in a field the last one is used for the unit string. If there is a mix of types the square type “[ ]” will be used for unit string.
All of the following examples are valid and will use “MPa” as unit string.
“Stress (MPa)”, “Stress (von-Mises) [MPa]”, “Stress (von-Mises) (MPa)”, “Stress [MPa] (von-Mises)”
All units that are available in the External Data setup are recognized. - Valid unit quantity names are: Stress, Strain, Temperature, Pressure, Heat Transfer Coefficient, Heat Flux, Heat Generation, Heat Rate, Length, Velocity, Force, Force Intensity, Body Force Density.
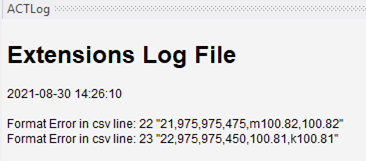
- Any format errors are printed in the ACT Log file together with reference to line number.
CSV File Transient Data
The csv file can contain transient data from a multi step analysis.
Setting “Calculate Time History = Yes” allows the usage of “Maximum over Time” and “Time of Maximum”.
Select the first “Set” in the “CSV Item” list box.
The formatting of the csv file is the same as described above but with the following additions.
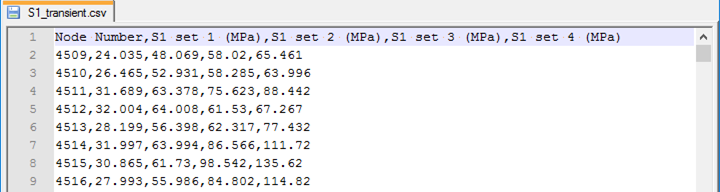
- The result name must be unique for each step.
- All steps have the same quantity (e.g. Pressure) and unit as the first selected one.
Tip: Use the “CSV Filter” to limit valid Items, e.g. “MPa”.
CSV File Multiple Load Case Data
The csv file can contain data from multi load cases, LC, analysis with multiple result steps per load case as long as the node/elements numbers remain the same. E.g. from a design point, dp, study.
Setting “Calculate Time History = No” allows the usage of “Max/Min/Avg Over Items” and “Item Of Max/Min”.
The formatting of the csv file is the same as described above but with the following additions.
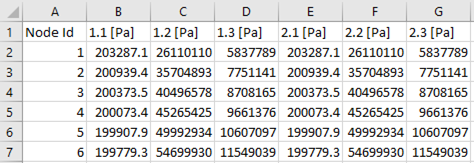
- The result name must be unique for each step.
If the result name has the format “LC.Time [unit]” or “LC.Step (unit)” where LC and Time/Step are integers the result “Item Of Max/Min” will display the number “LC.Step”. Otherwise, the column index number in the CSV Item list is displayed. - All steps have the same quantity (e.g. Pressure) and unit as the first selected one.
Tip: Use the “CSV Filter” to limit valid Items, e.g. “Pa”.
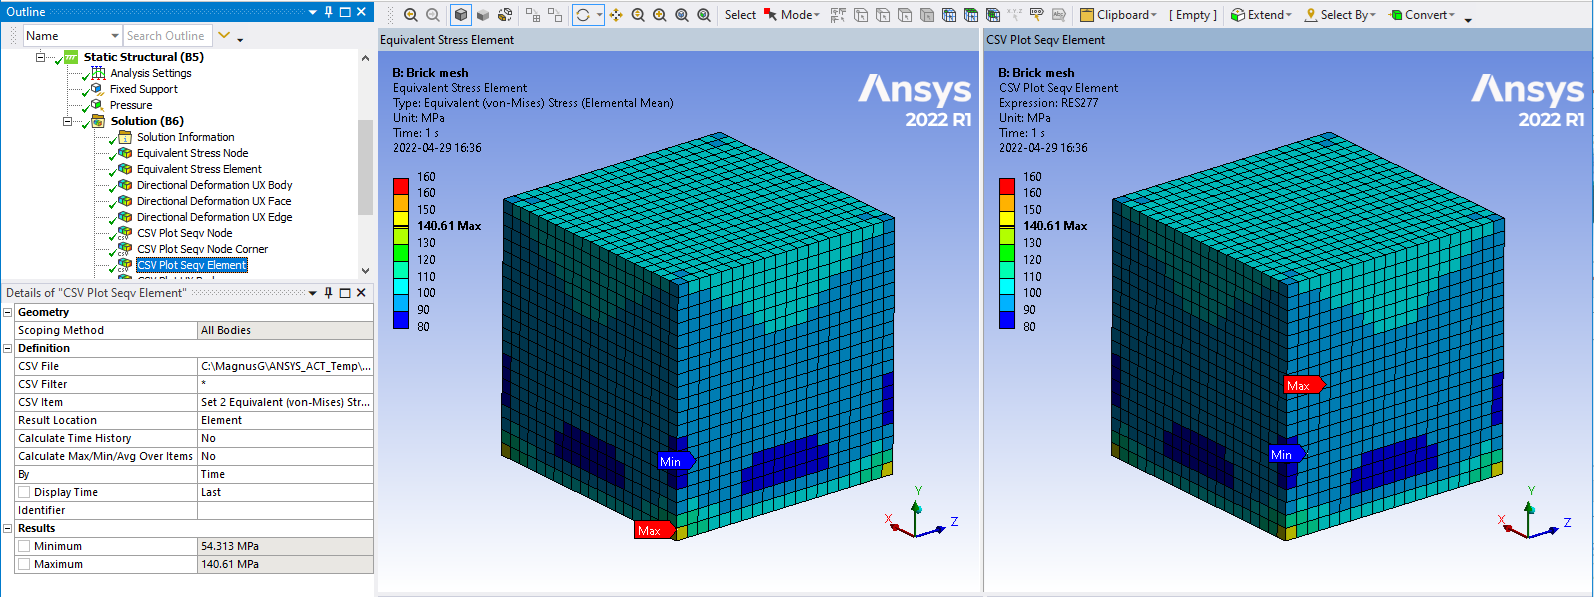
CSV Plot Example
A simple node and element example is included in the Downloads section.
User Defined Result
The result from a CSV Plot result object can be used as input in an User Defined Result Expression by defining an unique Identifier name.