CSV Map
Table of contents
 CSV Map
About
The CSV Map is a feature to map nodal or elemental grid result values from a comma separated values text file (csv) onto the current mesh. This feature is useful for comparing results from different versions of a model with different mesh and/or node/element numbers but with similar geometry.
Usage
Click the “CSV Map” button in the toolbar to add to the current selected solution.
Inputs to define the CSV Map are:
| Geometry | |
|---|---|
| Scoping Method | All Bodies (Default)/Geometry Selection/Named Selection |
| Geometry | Vertex/Edge/Face/Body/Node/Element |
| Definition | |
| CSV File | Open file dialog to browse to the csv file. |
| CSV Filter | Text to identify items to use. (Default *) |
| X/Y/Z Coordinate | List box to select the corresponding coordinate. |
| Coordinate System | Select the system for the csv data. |
| Show CSV grids | Display the csv grids to verify the coordinates. |
| Map quality | 5/10/15 (Default)/20/25. 5: Poor but fast, 25: Good but slow. (i) |
| CSV Item | List box to select one of the available results in the csv file. |
| Result Location | Node (Default)/Element Type of data in the CSV file (ii) |
| Calculate Time History | No (Default)/Yes Set to “Yes” to use “Maximum Over Time” or “Time Of Maximum” |
| Calculate Max/Min/Avg Over Items | Alternative to “Calculate Time History = Yes”. See page CSV File Multiple Load Case Data. |
| By | Time (Default)/Result Set/Maximum Over Time/Time Of Maximum |
| Display Time | Load step time for deformed shape. |
| Identifier | Result item name for use in User Defined Result “Expression”. |
(i) Map quality
Mapping is using MAPDL map algorithm, *moper command.
CSV Map File Definition
The same rules applies to the CSV Map file as for the CSV Plot file definition with the following additions.
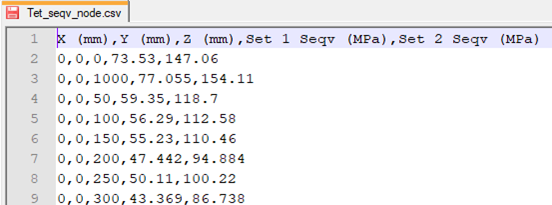
- There must be at least one or more coordinate columns (depending on source data type (edge, surface, body)
Node or Element numbers are not needed. - A unit string is optional. Without a valid unit string the coordinates will be using “m” and result will be “Dimensionless”.
- Transient data columns must be defined to the right of the coordinate columns.
- Different transient data can exist in the same file, e.g. thermal convection coefficient and bulk temperature, if they are defined in blocks of columns or identified by unit using the “CSV Filter”.
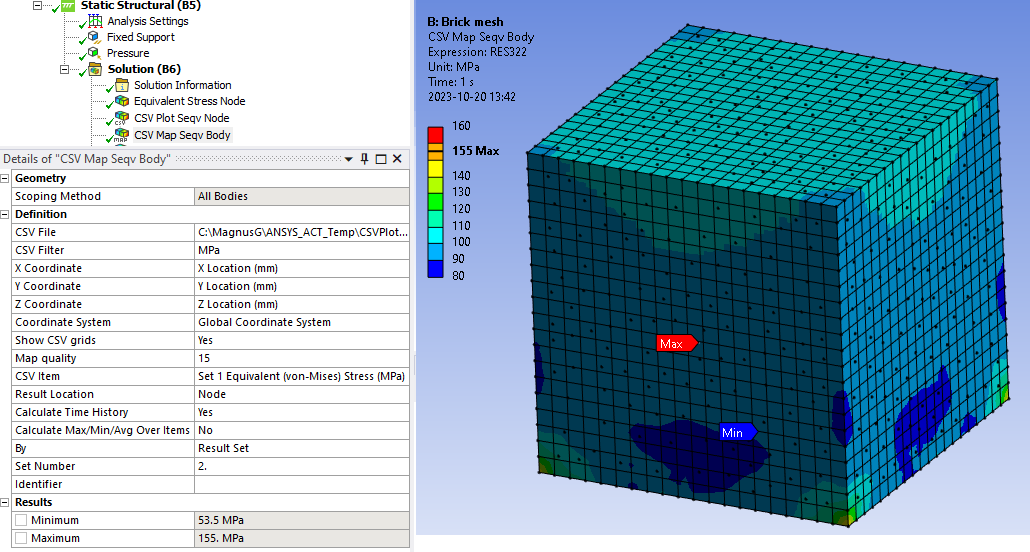
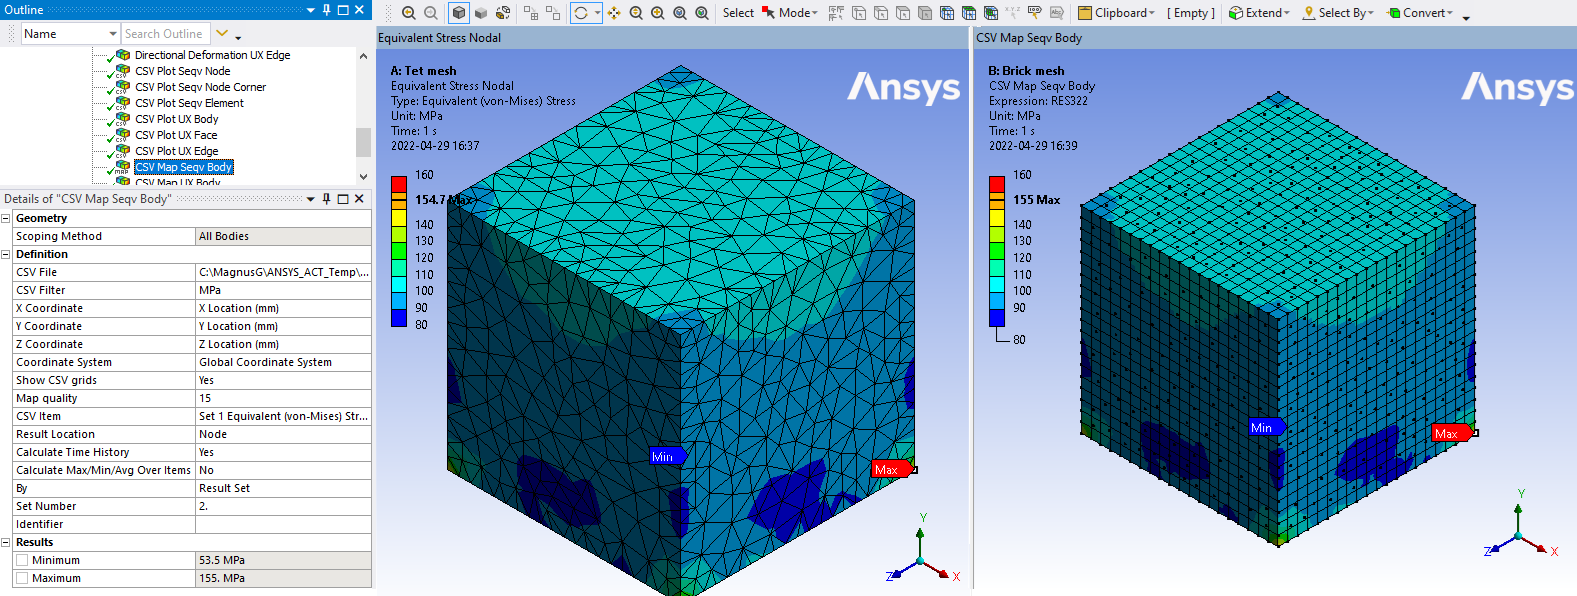
CSV Map Example (Body)
A tetrahedron mesh result is exported from one system and mapped to a brick mesh in another system. This example is included in the demo model in the Downloads section.
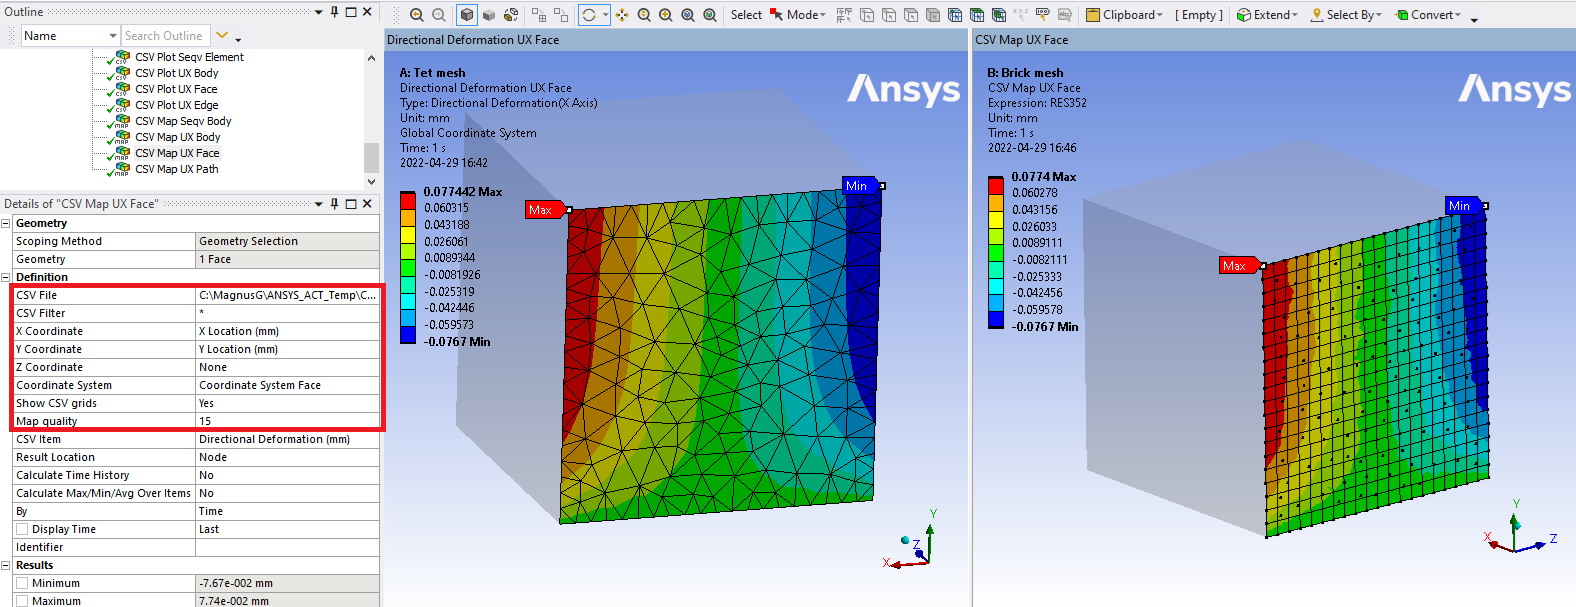
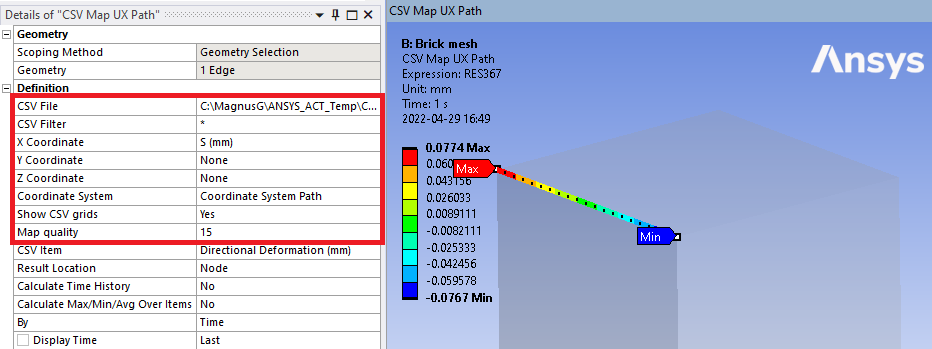
CSV Map Example (Face and Path)
Face and edge/path results can be mapped to any location using a coordinate system. This example is included in the demo model in the Downloads section.
Expert Tip - Compare results
Compare results between two models with different mesh is difficult. With the CSV Map any result data in Mechanical can be mapped to a new mesh to allow visualization and manipulation of results.
The process has the following steps:
- Create the result you want compare and export it to a text file.
Open the text file in e.g. Excel and save as a csv file. - Change model, re-mesh, update loads etc. and create the same result and export to a second csv file.
- Map the first result to the current model using CSV Map.
Browse for the first csv file, scope the Geometry and assign X/Y/Z Coordinate and CSV Item.
Verify the source grid points before evaluate. - Export the mapped original result to a third csv file.
- Now you may manipulate the data. E.g. copy the result column from the second csv file into the third csv file and create new result columns and save.
- Create a CSV Plot result and select the third csv file and plot selected items.