Soil Stiffness Documentation
Table of contents
 Soil Stiffness
About
The “Soil Stiffness” object creates non-linear stiffness boundary condition with friction on the structure.
It is used in the same fashion as the “Elastic Support” to introduce flexibility at a boundary.
Usage
-
Click the “Soil Stiffness” button to add to the current selected Structural analysis.
-
Make sure “Large Deflections” is activated in Analysis Settings.
Inputs to define the Soil Stiffness are:
| Geometry | |
|---|---|
| Scoping Method | Geometry Selection/Named Selection |
| Geometry | Faces of solid or shell bodies. |
| Definition | |
| Input Method | Manual (Default)/From File, Input stiffness manually or read from file. |
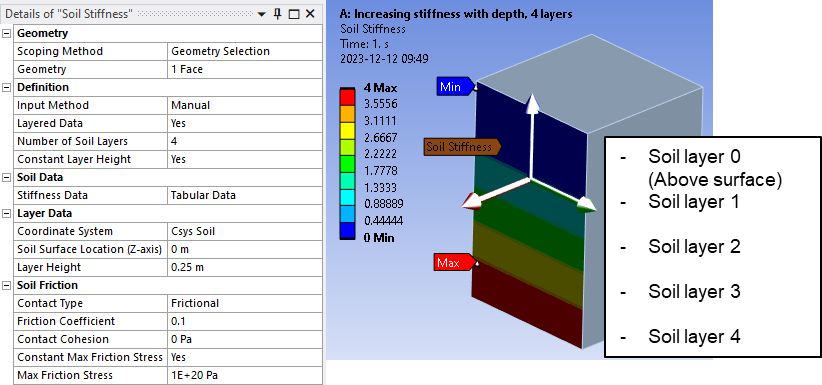
| Layered Data | Yes/No (Default), Specify if using multiple layers with individual stiffness curves. |
| Number of Soil Layers | Number of individual soil layers to define (Default 2). |
| Constant Layer Height | Yes (Default)/No, Specify if all soil layers have the same height. |
| Data File | Specify the Soil Data File from which to read soil stiffness. Visible if “From File”. |
| Soil Data | |
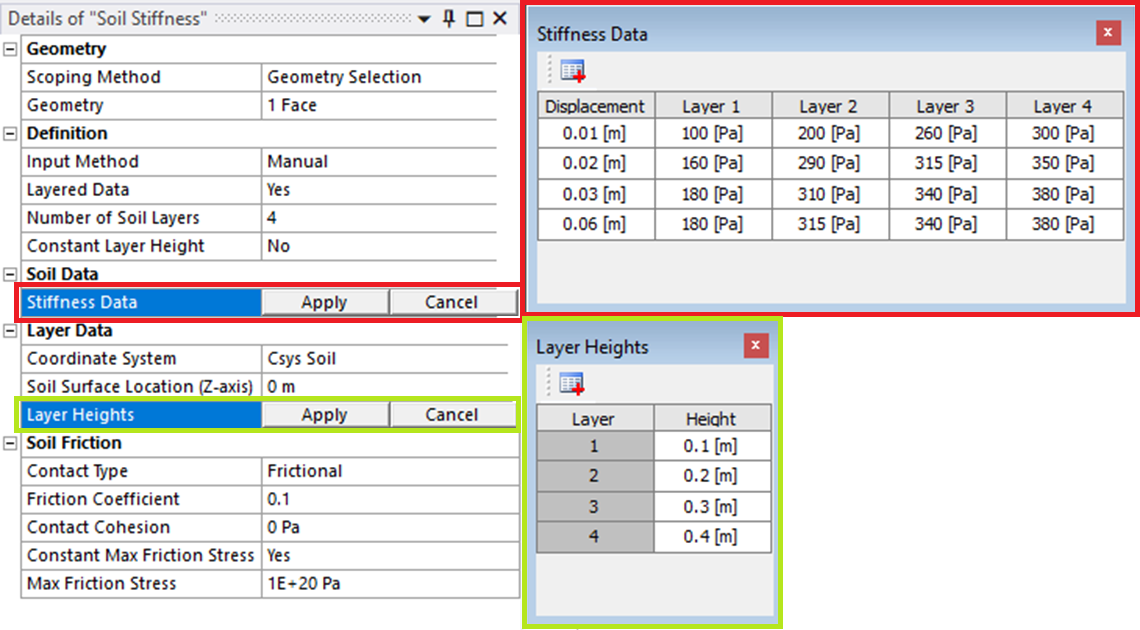
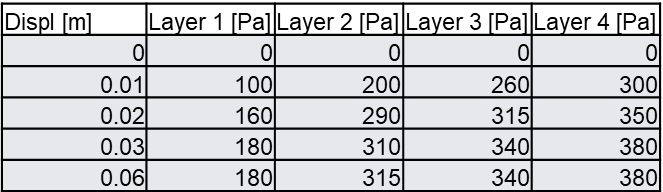
| Stiffness Data | Tabular Data input of displacement vs. pressure values for each soil layer. |
| Layer Data | |
| Coordinate System | Coordinate system to orient the soil vertical direction (z-axis). (i) |
| Soil Surface Location (Z-axis) | Coordinate of soil surface. (ii) |
| Layer Height | Single value or Tabular Data input of the height of each soil layer. |
| Soil Friction | |
| Contact Type | No Separation (Default)/Bonded/Frictional |
| Friction Coefficient | Soil friction coefficient (Default 0.1). Visible if “Frictional” |
| Contact Cohesion | Friction stress at zero contact pressure (Default 0.0). Visible if “Frictional” |
| Constant Max Friction Stress | Yes (Default)/No. Visible if “Frictional” |
| Coordinate System | Coordinate system to orient the soil vertical direction (z-axis). Visible if “No” |
| Max Friction Stress | Maximum friction stress value (Default 1e20 Pa) or Tabular Data |
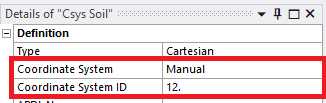
(i) Coordinate System
Must be a Cartesian system with “Manual Coordinate System ID” .
(ii) Soil Surface Location (Z-axis)
The location of the soil surface relative to the selected coordinate system origin.
The soil layers start at this height and build downwards in the negative Z direction.
Stiffness Data and Layer Heights
-
Click the “Tabular Data” field to edit the “Stiffness Data” and “Layer Heights”.
-
Add rows using the “plus” button.
Delete rows by right-click on a row and select “Delete selected row(s)”. -
Accept the data by clicking on “Apply” button or close the window by clicking “Cancel”.
Soil Data File
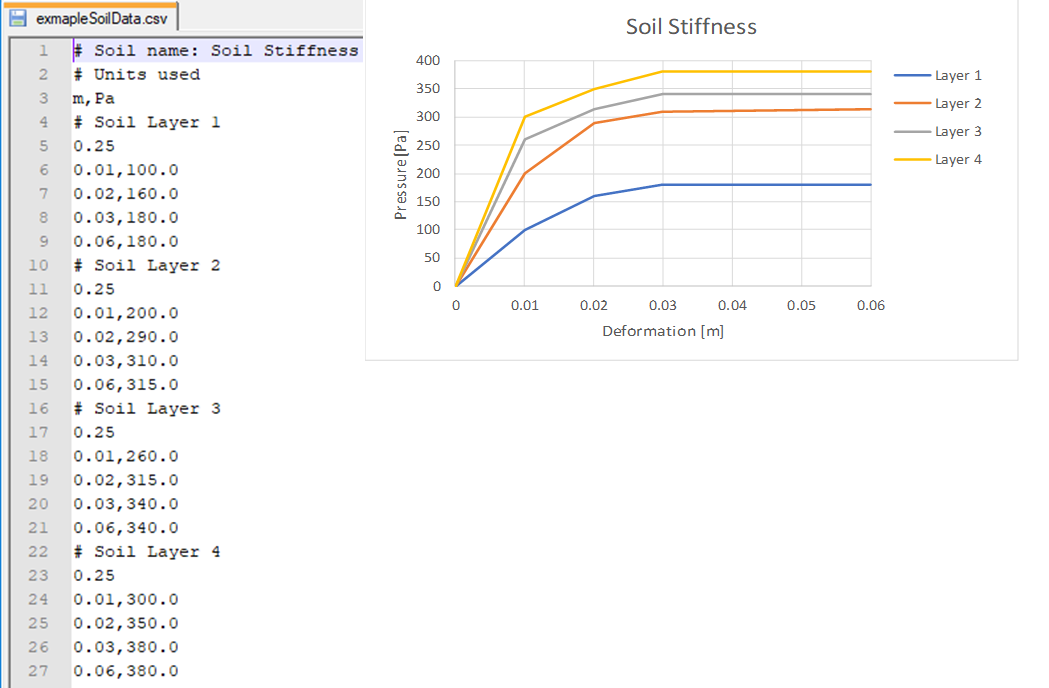
An example soil stiffness file “exampleSoilData.csv” is included in the “user_files” folder of the example model “SoilStiffness_V231.1.wbpz”.
The definition of the file must follow these rules.
-
If the first line contains “# Soil name:” the Soil Stiffness object is renamed accordingly.
-
All text on a line after a “#” symbol is treated as a comment and ignored.
-
The first uncommented line in the file must declare the length and pressure unit, e.g. “m,Pa” or “mm,MPa” (comma separated).
-
After the unit declaration line is found, each layer of soil must be defined as;
one line with the layer depth followed by lines of displacement vs. pressure (comma separated).
The soil data file may be defined using “Nordic” list separator “;” and decimal comma “,” symbols.
Soil Data File Export
When the soil stiffness and layer height is defined the data can be exported to a soil data file by right-click on the Soil Stiffness object and select “Export Soil Data”.
The current unit is used when exporting and the default location is the “user_files” folder.

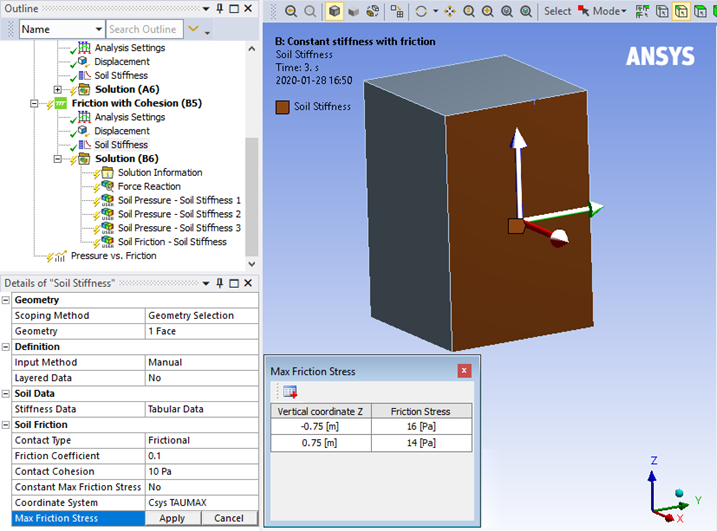
Tabular Max Friction Stress
If “Constant Max Friction Stress = No” a cartesian “Coordinate System” must be selected to define the tabular data for “Vertical coordinate Z” and the “Friction Stress”.
Vertical coordinate Z must be defined in ascending order.
For Z-values outside of the defined range the nearest friction stress value is used.
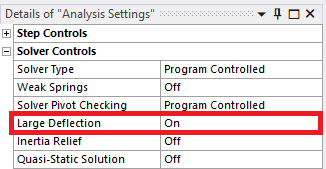
Analysis Settings
To account for the non-linear soil stiffness “Large Deflection = On” must be set in “Analysis Settings”.
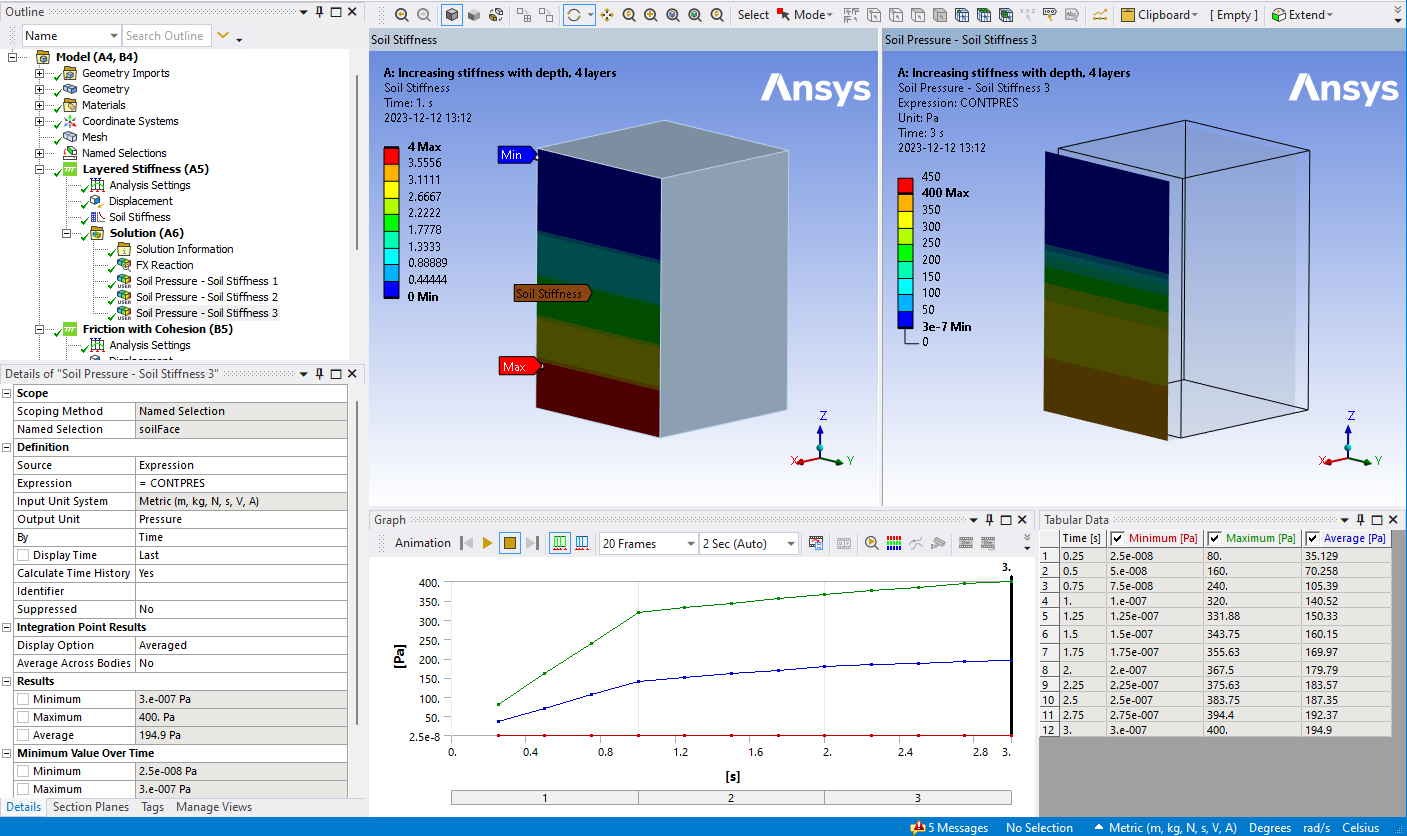
 Soil Pressure
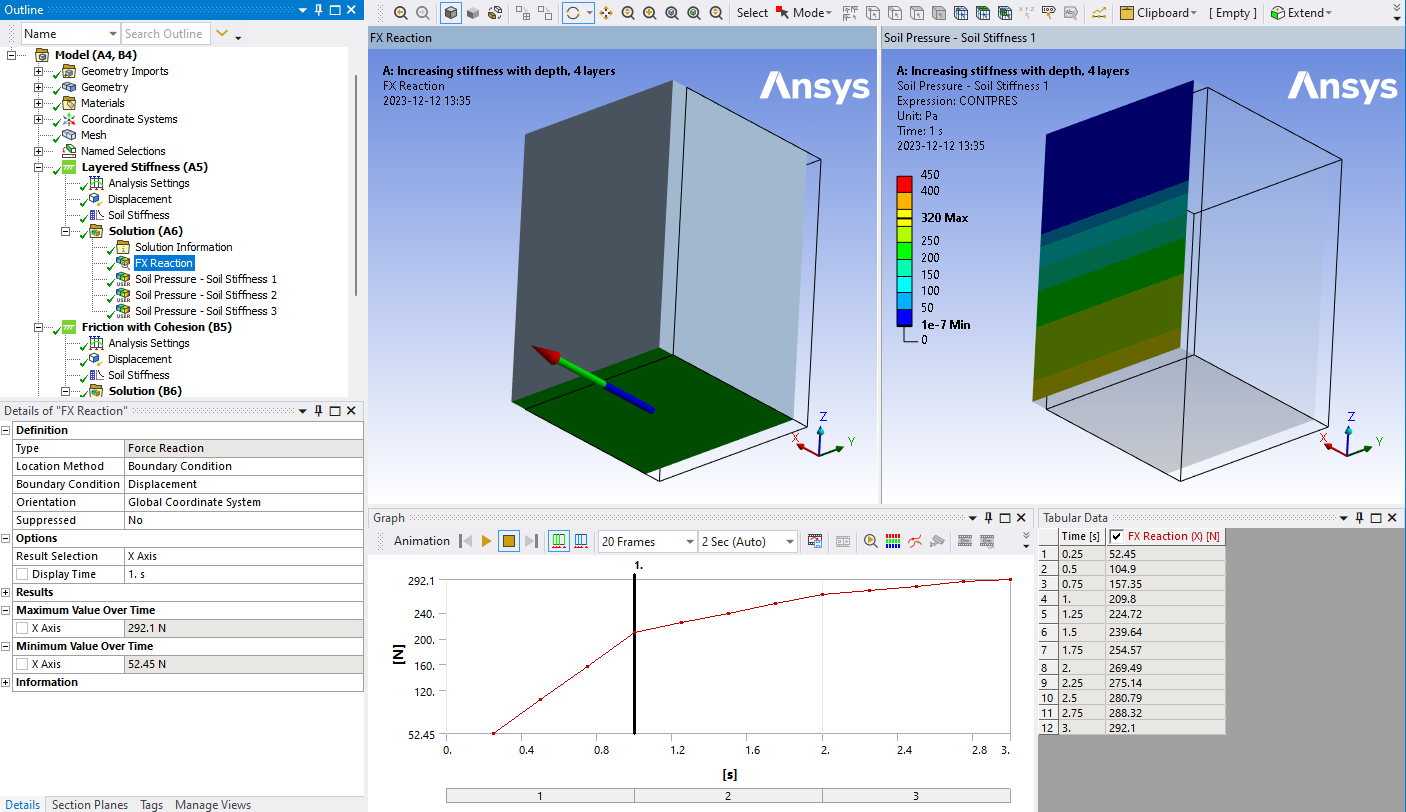
The resulting soil contact pressure can be plotted using the “Soil Pressure” result.
Select the “Soil Stiffness” object(s) in the Analysis Setup and click the “Soil Pressure” button to create corresponding result object(s).
 Soil Friction
The resulting soil friction stress can be plotted using the “Soil Friction” result (if using “Frictional” contact).
Select the “Soil Stiffness” object(s) in the Analysis Setup and click the “Soil Friction” button to create corresponding result object(s).
Verification
Contact Stiffness
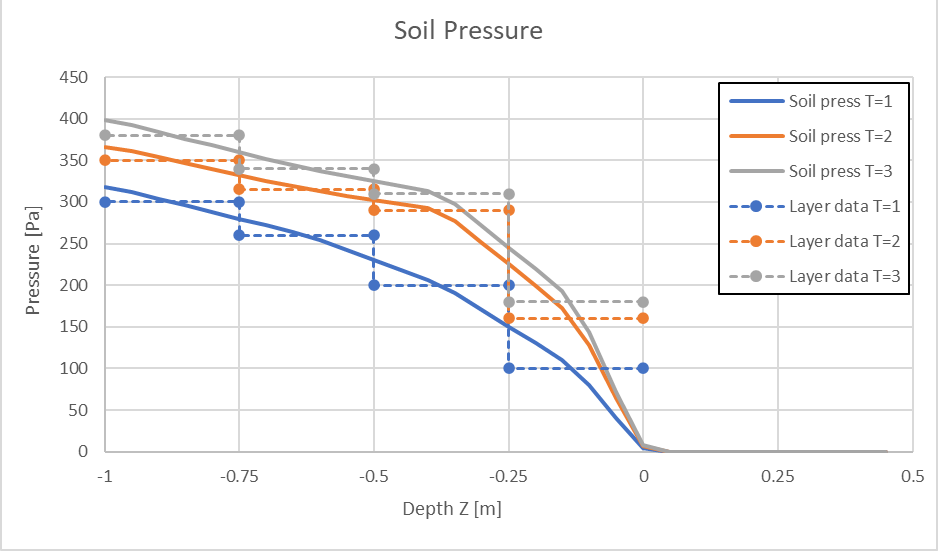
The contact stiffness, FKN, is defined as the soil pressure divided by the displacement, see the dashed lines in the graphs below.
If the number of data points is few the interpolation of contact stiffness with respect to displacement will introduce an error when calculating the resulting soil pressure, see the solid lines in the graph below where the resulting layer pressure does not match the given soil data for interpolated points.
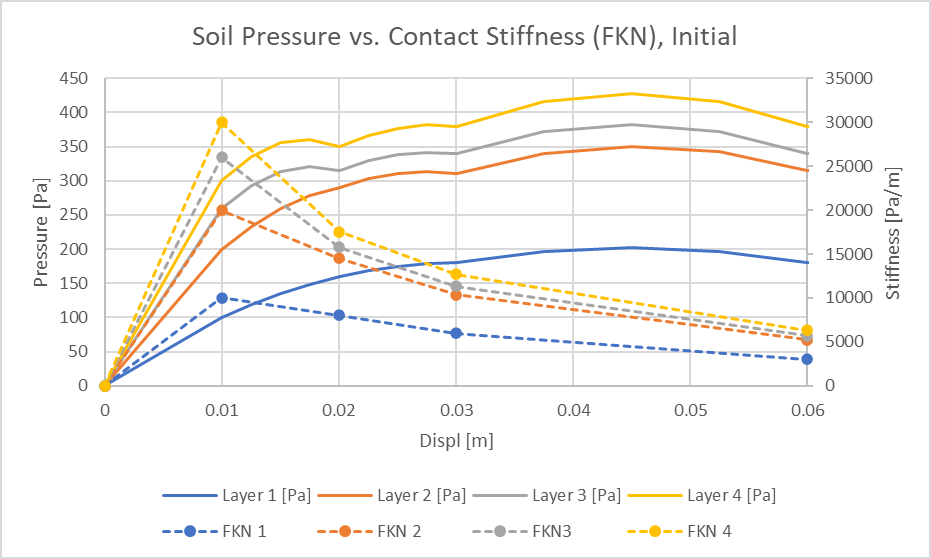
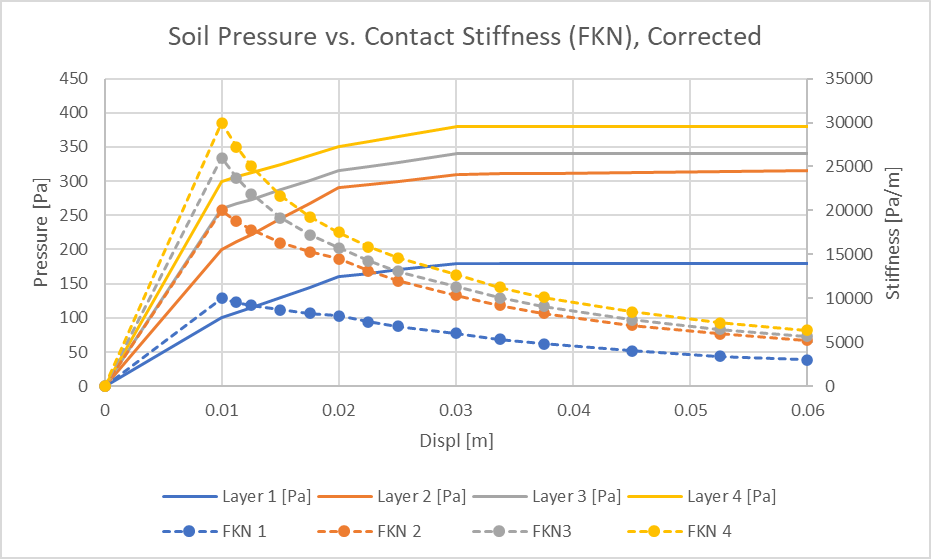
The contact stiffness, FKN, is automatically corrected so the resulting contact pressure match the soil data with a tolerance of 1%, see the graph below.
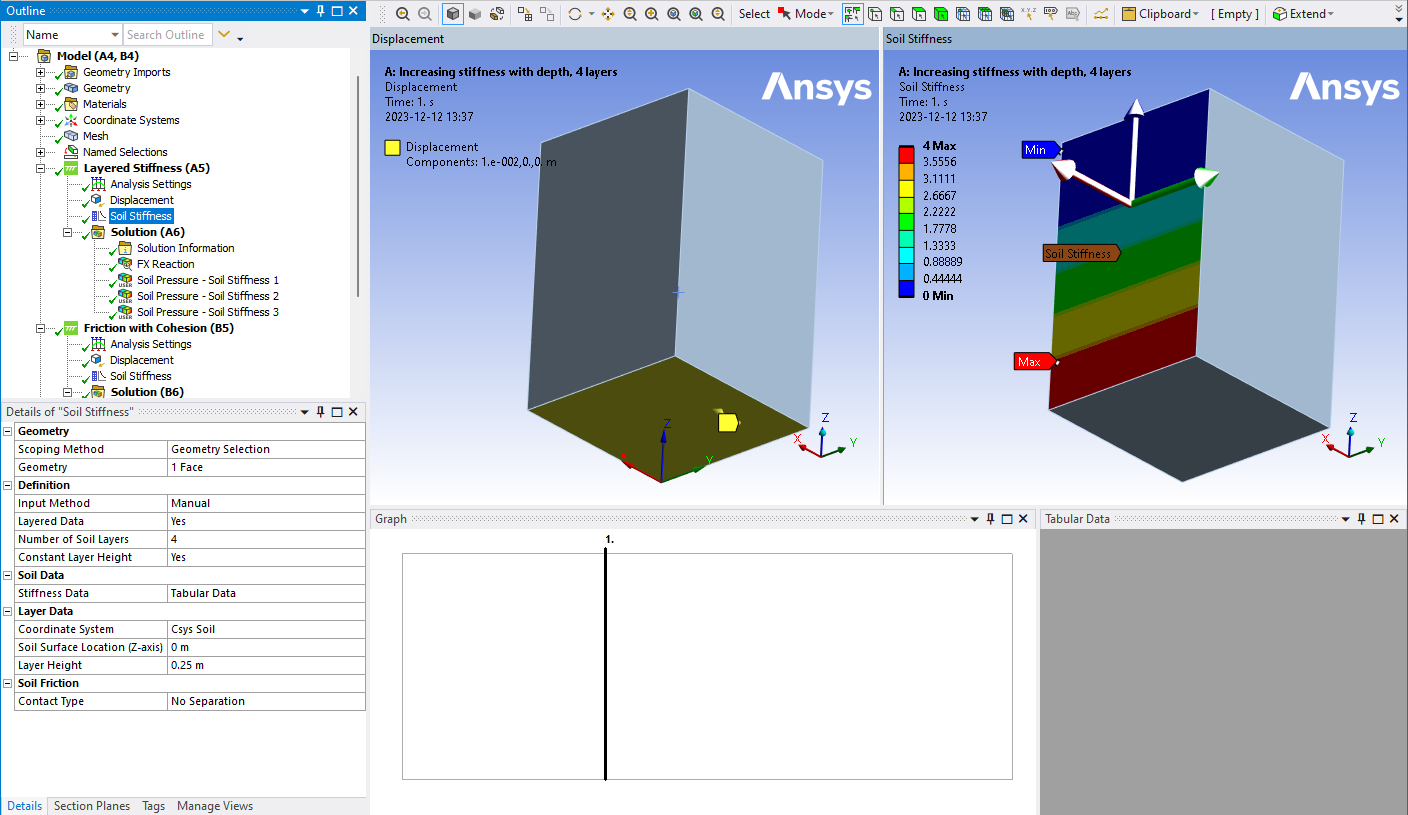
Test case 1 Setup
The soil stiffness is internally defined using a contact with contact stiffness defined as a function of vertical location and penetration. The soil stiffness is the same in compression and in tension.
The penetration tolerance is defined as twice the largest value given, such that the contact is maintained up to this value.
If using the “Frictional” option, the contact will open if not in compression.
The example model “SoilStiffness_V231.1.wbpz” is solved in three steps, one for each of the first points in the soil data table.
Four sub-steps are used to verify that the soil data is interpolated correctly.
!
Test case 1 Results
The reaction force is piecewise linear within each load step to verify that the interpolation of soil data is correct.
Each layer area is 0.25 m2 and the resulting theoretical reaction force for each layer and the layer sum, “FX sum”, is printed in the table below.
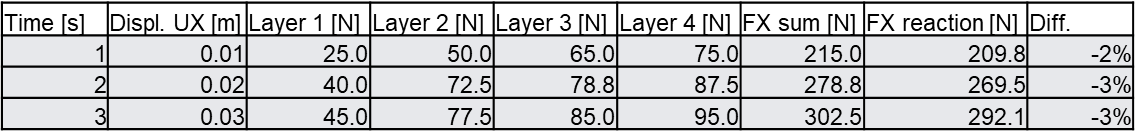
A path result of the soil pressure is compared with the soil layer data in the graph. The contact stiffness is linearly interpolated in the depth direction from the layer data using the layer mid-point when calculating the pressure.
Therefor the resulting reaction force, “FX reaction”, might be slightly smaller than the theoretical value. Compare the area below “Soil press” and “Layer data”. The difference is -3%.
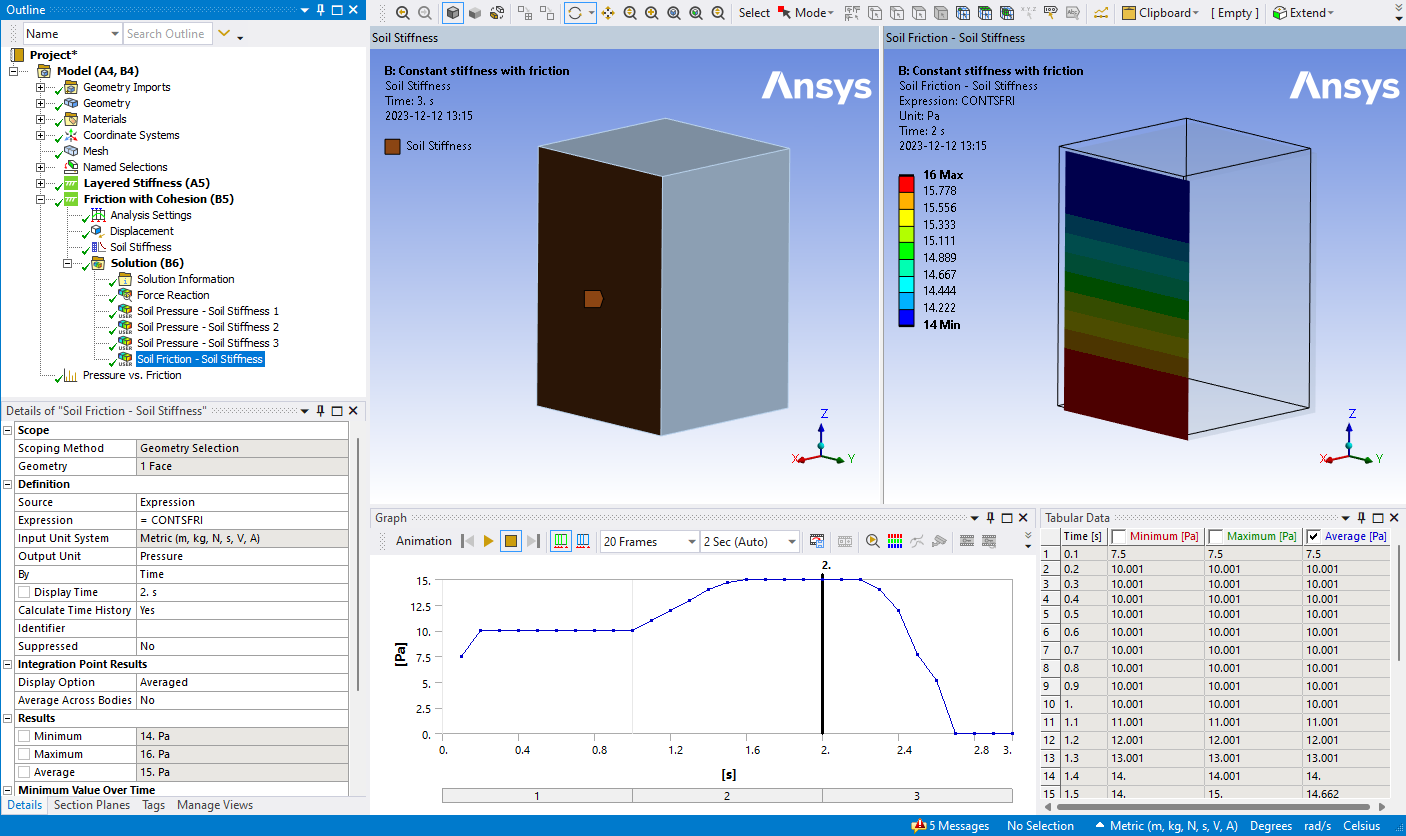
Contact Friction
If using the “Frictional” contact option the contact Friction Coefficient, Contact Cohesion_ and Max Friction Stress can be defined for the soil stiffness object, see the example model “SoilStiffness_V231.1.wbpz”.
Test case 2 Setup
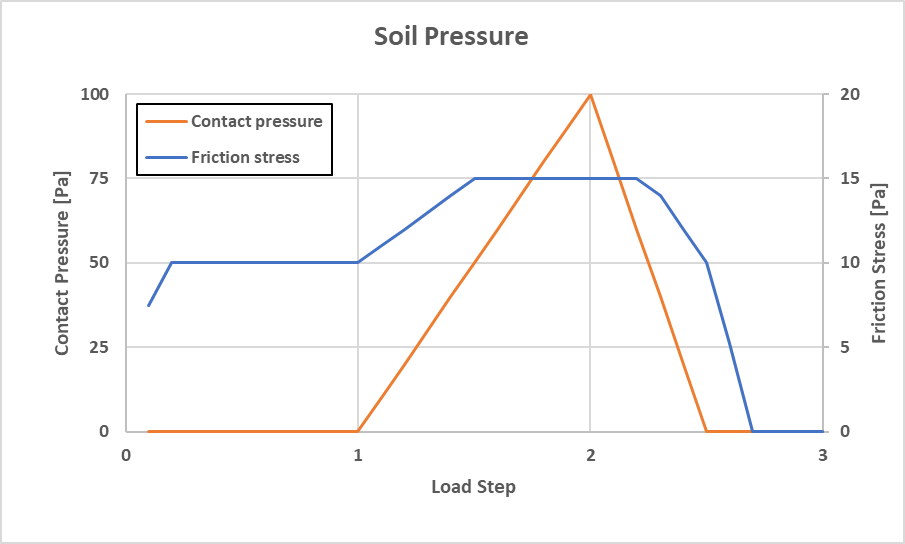
The first step is sliding with Contact Cohesion.
The second step is combined Contact Cohesion and contact Friction Coefficient with a limiting Max Friction Stress
The third step is contact opening.
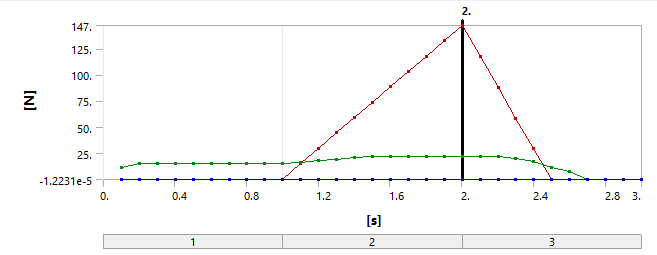
The boundary condition is a Displacement with constant lateral sliding (Y) and compression (X) +/- 0.01 m, see the graph in the figure below.
The Soil Stiffness is defined as constant with a value 100 Pa/0.01 m.
The Contact Cohesion is 10 Pa and Max Frictional Stress is 15 Pa (Defined both as constant and tabular).
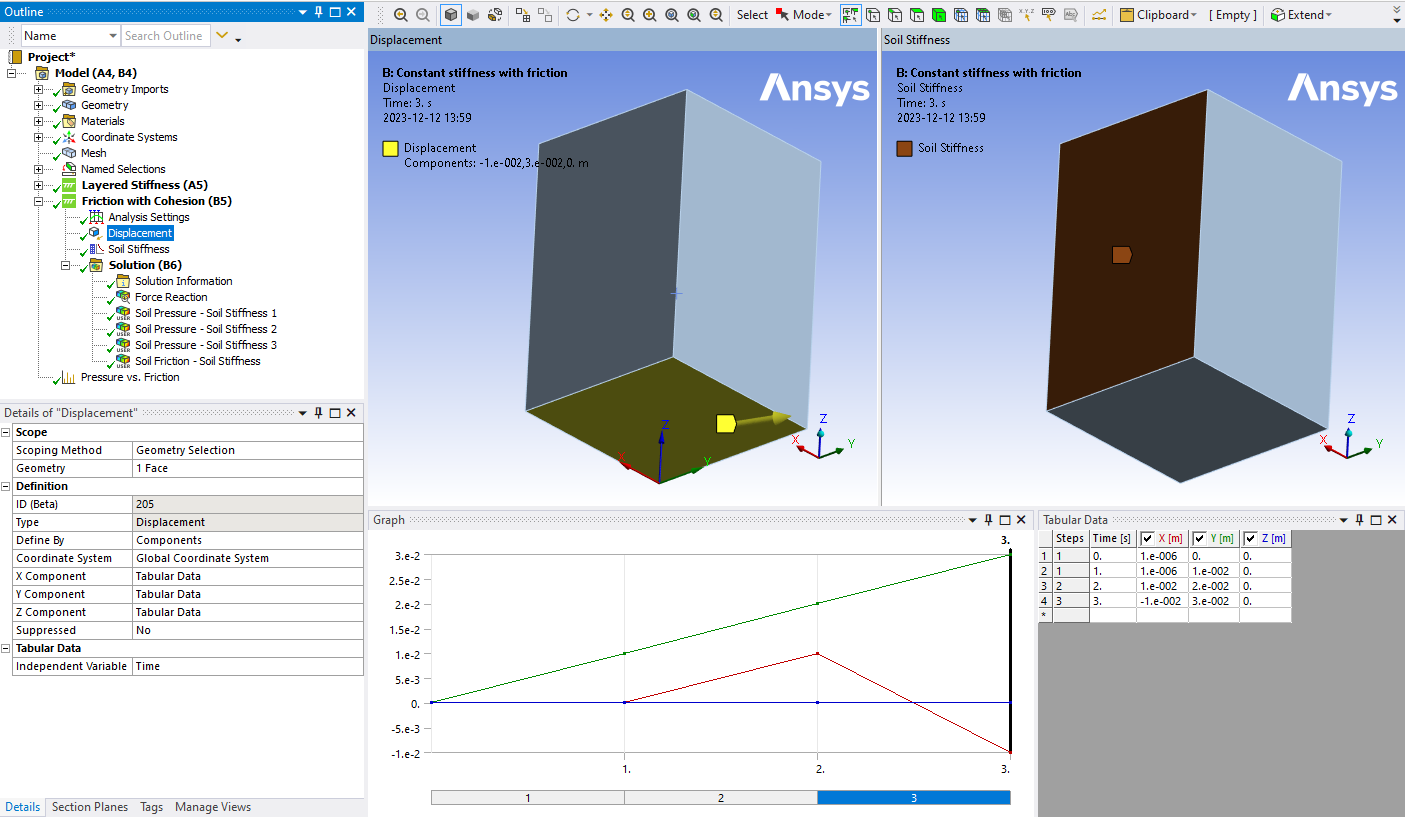
Test case 2 Results
The resulting soil Contact pressure and Friction Stress is plotted in the figure below.
The resulting Reaction Force is plotted in the figure below. (Surface area 1.5 m2).